VISUALISATION ANALYSIS #3

http://www.guardian.co.uk/news/datablog/interactive/2012/mar/26/office-for-national-statistics-health

Simon Rogers has published a fantastic interactive graphic for the Guardian Datastore that maps teenage pregnancy rates in England and Wales from 1998 to 2010.

The visualisation shows the conception rate of under-eighteen year olds, per 1000 women, in different counties across England and Wales. The interactive map is an ideal way to present the information, as the visualisation contains a large amount of data in a comprehensible way. From the graphic we can derive that the number of teenage pregnancies has declined in the last decade, although this varies by area.

In order to focus on a specific county the user can scroll the mouse over the map and click on a different area, labelled by county at the side of the map. Once you click on a county the line graph changes to show the counties’ change in number of teenage pregnancies by year and how this compares to the England and Wales average. This allows the user to have more detailed and specific information simply by clicking on the infographic. Thus the graphic allows users to see the more personalised, local data.

By using this tool the user can focus on various localised data, and see how they compare with each other. For example, in Wales it is apparent that poorer counties, such as Merthyr Tydfil and the South Wales Valleys, are significantly over the national average regarding the number of teenage pregnancies. In contrast, geographically close but wealthier counties like Monmouthshire and Powys are below the national average. In most cases this has not altered over the decade.

The map thus proves that in certain circumstances seeing only the larger data can give a limited understanding, as it shows a national decline in the number of teenage pregnancies but does not tell us that many individual counties have not changed significantly. In this way a graphic of this kind presents to users the ‘big picture’, in a clearer way than text alone.

The graphic also allows users to ignore information that is not of interest to them and to focus on geographical locations that are. This gives users a certain amount of control over the visualisation, as information is not decided for the user, as would be the case with textual narrative.

The interactive element of the visualisation allows users to find the story or information for themselves with no difficulty. This is more satisfying than simply being told information. At a time when the general public’s trust in journalism is low, visualisations such as this demonstrate that the journalist has not played around and sifted information but presented all of it to the user and allowed them to draw their own conclusions. In this way the user can get a more detailed, accurate and neutral understanding of the issue presented. It also breaks down the barrier between journalist and user and implies trust in the user to interpret and organise the data in an intelligent way.

The graph also uses visual symbols to organise the large amount of data. The map of England and Wales is easily recognisable, as is many of the counties. The counties that are under the national average are a light shade of blue and this gets darker as the percentage increases. The use of blue and purple makes the map visually attractive and the differences in shade easily identifiable. It is apparent that darker areas cluster together and that generally the North of England is darker than the South. In this way the user can obtain information from the visualisation by looking at it alone. The darker shade of purple stands out amongst the generally lighter shades and thus the graphic signals to the reader some of the most dramatic information. Thus, although the user is given control and the freedom to explore the data and draw their own conclusions, visual signals guide them to the most extreme data.

The orange circle that is drawn around a county when it is selected contrasts with the blue, making it clear. It also correlates with the colour of the line graph, making the visualisation easily readable.

By pressing ‘play’ the user can focus on one county and see how it breaks down by each year, as well as how the colours across the UK has changed by year, thus presenting more information.

The visualisation thus works as it presents a large amount of data comprehensibly. It allows the user to interpret and organise the data, but gives them visual signals to guide them. It also gives information for the whole country, as well as localised data, thus presenting the ‘big picture’. It is clear and easy to read and breaks down the barrier between journalist and user. It is therefore an excellent way to present the data.

PIP implants – the emotional and the statistical: looking at Department of Health data

The PIP implant scandal has been rumbling on, with no resolution, for a protracted period now.

It’s exactly two years since France’s health regulator, AFSSAPS, ordered the withdrawal of silicone breast implants made by PIP.

But the issue only reared its head in the UK at the back end of 2011 – 21 months after AFSSAPS and indeed, its UK equivalent the Medicines and Healthcare Products Regulatory Authority (MHRA) knew they were substandard.

Last week, the Commons health select committee stated that the UK government response has been “inadequate”. As if to compound this, MHRA head, Sir Kent Woods (speaking in front of the committee), admitted he could not give an assurance that no PIPs were implanted after the 2010 withdrawal. “One sincerely hopes that it did not happen,” he said sheepishly.

Latest figures suggest that the total number of women affected in the UK is 47,000; 95% of women had the operation privately, 5% on the NHS.

There is a whole maelstrom of issues tied up with PIPs. Who is responsible for removing them? Indeed, should they be removed?

At its heart is data; numbers, costs, medical research, timelines. All of which seem impossibly hazy – particularly when it comes to analysing the long-term health consequences of having industrial-grade silicone inside your body.

But in addition to the statistical emphasis, this story has deep emotional resonance. Irrespective of your thoughts on breast augmentation, you can’t dispute the immorality of a) sanctioning the use of PIPs in the first place and b) allowing their use to continue in full knowledge of the possible dangers.

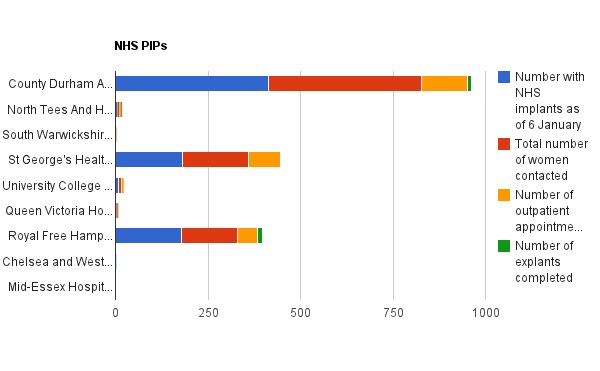
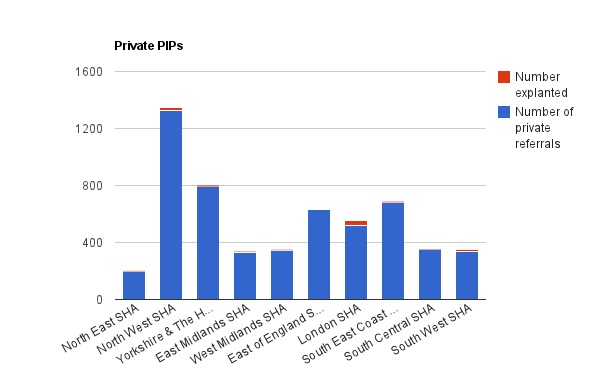
Since January the Department of Health has been releasing bi-weekly data collections monitoring the “NHS Offer” in England; one set monitors the number of private PIP patients who have presented to the NHS, the other tracks women who have PIP implants implanted by the NHS.

The stats are interesting in light of the ruckus last week – that women face two operations instead of one due to NHS small print.

Over 5000 women have been referred to the NHS from private companies including Transform and Harley – but under 100 thus far, have had their implants removed.


And as for the NHS treated patients, a tad under 800 women are reported to have PIPs as of 6 January (the first release date for the stats).

The data is interesting also because of what’s not here. What of the other 40,000 women with PIPs who haven’t presented for a referral? A proportion, I guess won’t be in England. Some of will be treated privately. Some will chosen not to have their implants looked at.

And why, is the NHS data drawn from a very limited number of trusts (a meagre nine)? Did only nine use PIPs? If so, why?

So many questions – a few posts-worth – are remaining, about the ethical issues, as well as the data.

Visualisation Analysis #2

Simon Rogers has created a visualisation showing death penalty statistics, country by country, for the Guardian Data Blog.

http://bit.ly/hdFOpa

http://bit.ly/hflX1V

The visualisation uses a bubble graph on a map of the world to depict how many people have been given death sentences and how many people have been executed in 2011. This is then broken down by country, giving users the opportunity to compare and contrast regions.

Continue reading “Visualisation Analysis #2”

Visualisation Analysis #1

Following on from my earlier post exploring different ways to present data, I have decided to analyse two examples of visualisations from the Guardian Data Store.

http://bit.ly/HsqsLf

The first is a map of UK fuel shortages; ‘The Petrol Panic Mapped’. The map works because it is clear, simple and easy to use. The map is interactive, giving the user control and allowing them to display the information in the way that best suits them, prioritising data that they find most interesting. It also makes viewing the map a more entertaining experience, keeping users on the page for longer.

Continue reading “Visualisation Analysis #1”

How much does society actually mix?

The Office for National Statistics recently released results from the Citizenship Survey, conducted by the Department for Communities and Local Government for 2010-2011. The survey aimed to find out the level of integration in the UK between different ethnic and religious groups. The data was categorised by locations that people are likely to mix, for example at the shops, within schools, at work and within the home. Continue reading “How much does society actually mix?”

How to do a good visualisation and why it’s important

Visualisations are an important tool when presenting data, and can be used to show patterns, correlations and the ‘big picture’.

Ben Fry has said that visualisations ‘answer questions in a meaningful way that makes answers accessible to others’ and Paul Bradshaw explains that ‘visualisation is the process of giving a visual form to information which is otherwise dry or impenetrable.’

Traditionally stories have been conveyed through text, and visualisations have been used to display additional or supporting information. Recently, however, improved software has allowed journalists to create sophisticated narrative visualisations that are increasingly being used as standalone stories. These can be be linear and interactive, inviting verification, new questions and alternative explanations.

Continue reading “How to do a good visualisation and why it’s important”

Why data should matter to local journalism

At City University, we have spent the past three weeks running a local news service for Islington. Along with door knocking and vox popping, data was an endless source of stories – from car parking charges to pregnancy rates.

But while the data is easy to find – a local authority breakdown of statistics is normally available in supplementary tables – the story isn’t always obvious.

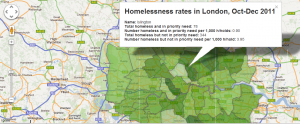
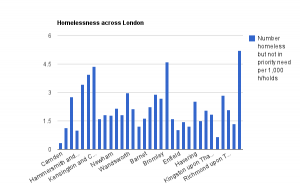
Having heard councillors warn that Islington’s homeless population has grown rapidly out of control, we looked at the newly released national homelessness statistics to see how it compared with other London boroughs.

But on first glance, Islington appeared to have low levels of homelessness. In terms of the numbers accepted as being homeless and in priority need it rated 19th worst out of 33 boroughs.

When we looked at the total number of “non-priority” homeless people the figures were more shocking – Islington had the 6th highest in London. And, after we factored in the size of Islington – which is far smaller than other boroughs – we found Islington had the fourth highest rate, per 1,000 households.

The exercise proved data journalism isn’t just for the nationals – and that by examining statistics  from a local perspective, journalists can make more sense of the numbers.


Exposing abuse: the maltreatment of vulnerable adults in England

Image by Henry Rabinowitz via Flickr

Last year’s Panorama investigation into abuse at Winterbourne View Care Home, shone a much-needed spotlight on the treatment of vulnerable people. It’s an issue never far from the headlines, particularly as care services continue to be squeezed.

Earlier this month a revealing collection of data was unleashed, collating alerts and referrals of abuse made during 2010/11 to adult social care safeguarding teams in England. And I thought I’d have a go at visualising them to bring forth some salient patterns. Continue reading “Exposing abuse: the maltreatment of vulnerable adults in England”

Visualisation showing patients detained under the Mental Health Act 1983

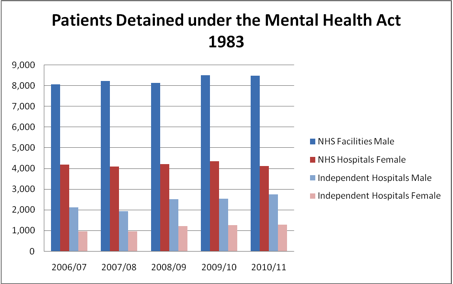
Here I have created a visualisation showing patients detained under the Mental Health Act 1983 over the last six years.

I took statistics from the mental health pages of the NHS website and downloaded them into an Excel spreadsheet. I then cleaned the data, taking out any information that was unnecessary and that would confuse the image. I rearranged the columns, data and information and made it easier to understand and clearer, visually.

I then experimented with Many Eyes, Google Docs and Excel graphs to create the visualisation. I tried other ways of presenting the image, in a pie chart and a line graph, but found that the bar chart worked best.

The information is broken down by gender as well as by type of hospital; NHS Facilities and Independent hospitals. The graph shows that more men have been detained under the mental health act than women, on a year by year basis. This is consistent with both NHS Facilities and Independent Hospitals. The number of men detained has also gone up marginally in the last two years, though has stayed relatively consistent over the last six years.

This is interesting because statistics have indicated that more women than men are diagnosed with mental health disorders, such as depression and anxiety. However, when it comes to severe cases, where patients are legally detained due to mental illness, men are significantly more likely to be affected.