From Asia and beyond: experts discuss data journalism challenges

This article was originally published on the Data Journalism Awards Medium Publication managed by the Global Editors Network. You can find the original version right here.

___________________________________________________________________________________________________________________


How easy (or difficult) is it to access data in China, Malaysia, Kenya, and other countries? Are there tested business models for data journalism in different parts of the world? How do you promote data literacy in newsrooms where innovation is not a priority? We’ve gathered international experts to tackle those questions, and discuss government interference, the pace of learning, and managerial issues.


Darren Long, head of graphics at South China Morning Post (Hong Kong), Kuek Ser Kuang Keng from Data N and former Google fellow at PRI (Malaysia), Eva Constantaras, Google Scholar from Internews and expert in data journalism for Africa, Asia and South America (originally from Greece), and Yolanda Ma from Data Journalism China, also jury member of the Data Journalism Awards competition (China), all joined us, as well as participants from other countries.


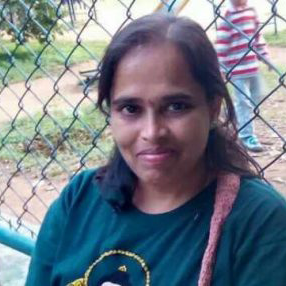
From left to right: Darren Long, Yolanda Ma, Eva Constantaras and Kuek Ser Kuang Keng


How widespread would you say data journalism is in your region?


Kuek Ser Kuang Keng: People like to see Southeast Asia as a ‘region’ but the fact is countries in this region are very diverse in terms of development stage, politics, and technology. So there’s no way to generalise them.

In Malaysia, my own country, data journalism is almost non-existent; there are only infographics. There is a strong interest among a small group of journalists, but they lack support from editors and management, who focus more on social media. Innovation in journalism is not prioritised. In neighbouring countries, such as Indonesia and the Philippines, things might be a little better, but they are still relatively far behind the West. In non-democratic countries where free press is always under siege like Cambodia, Vietnam, Laos, and Thailand, the landscape is totally different. There, the survival of independent journalism is above all other things like innovation.

Darren Long: It’s a good point. I was going to say Europe and America can feed off each other through the use of English language and a common Roman script whereas Asia is much more diverse. Press freedom is certainly an issue. Even in Hong Kong where we have a feisty and largely free press.

Visual journalism and the use of data is a good way to avoid government interference though. If you can use data to make your point from government sources, there is little they can criticise. The problem is getting public and government data. It is very hard to get consistent and reliable sources from Mainland China.


Yolanda Ma: In mainland China, since data journalism was introduced five years ago, it has been widely accepted and adopted by media organisations, from official newspapers to commercialised online portals. The development is limited due to the cost (both technical and human resources). It is more recognised by the industry than by the public.

Eva Constantaras: My specialty is introducing data journalism in countries where it basically doesn’t exist. General trends I see are: publishers get excited because it sounds digital and visual and sexy, mid-level editors and senior reporters are in denial about digital convergence and are afraid of it so don’t want to know anything about it, and early career journalists are excited about it for three reasons: 1. They want to still have a job once digital convergence happens 2. They think data visualisation looks fun and 3. (least common) they see how data can enrich their public interest reporting by making their stories more analytical.


How accessible is public data in your country? What advice do you have on how to access data (public or else)?


Darren Long: We have freedom of information but it’s a fine line.

Here are some useful websites: Open Data Hong Kong, Data.gov.hk and N3Con 2018.

Kuek Ser Kuang Keng: There’s no FOI in Malaysia, Singapore and other non-democractic Southeast Asian countries but it exists in Indonesia and the Philippines. While sensitive information is not available, Malaysia and Singapore governments do publish a lot of data online. Both countries have a dedicated open data portal and relevant policies.

However media in both countries don’t have a strong demand for government data nor the skill, knowledge, and habit to use data in their reporting. The main demand comes from the business/IT community which is adopting business analytics very fast. So before talking about accessing any data, there need to be awareness, skill, and knowledge within newsrooms on data journalism. It seems like this awareness is higher in Indonesia and the Philippines. There’s a specialised business data news startup in Indonesia called Katadata, that you may want to check out:


Eva Constantaras: The first excuse I get from journalists for not doing data journalism is that there isn’t enough data. In all the countries I have been in, I would not say that is among even the top 3 challenges. And partially that’s because nobody has ever used the little data there is, so they need to build up demand in order for more data to be released. The biggest challenge is finding journalists who are willing to abandon their jobs as stenographers and embrace their role as knowledge producers. This is not a problem data or technology can solve.

Darren Long: I agree with that. I find a lot of the problem is more about thinking how to visualise data in a creative manner than the non-existence of data.

Yolanda Ma: People usually have the impression that China doesn’t have much data but the reality is quite the opposite. There is tons of data, just not well published and usually unstructured. Sometimes the data is inaccurate and not reliable. There is a FOI regulation and media do use it for stories, but less for data.

But things are getting better, compared with five years ago. In China more data is released (effort has been made to convince government and also help them to get it right), the open data movement is still on and pushing for better data culture, especially collaboration between universities, companies, government, but also NGOs and citizens.


What are the main challenges data journalists face in your region?


Eva Constantaras: I think journalists underestimate the work that goes into a data story. It’s not enough to just use data to reveal the problem because of the ubiquity of corruption in so many countries. For a story to have an impact and get people’s attention, it has to measure the problem, the causes, the impact on citizens and potential solutions. That’s more work than journalists are used to. Many journalists just want to make visualisations. I tell them visualisations are the paint on the house. Their house can be a beautiful colour but if their analysis is bad, their structure is unsound, their pretty house will fall down.

Darren Long: Technology has been an issue for us. We have to create our infographics outside the company CMS and redirect the page. If we weren’t so stubborn we would have given up long ago

Kuek Ser Kuang Keng: Newsroom managers don’t have much awareness of data journalism and the digital disruption has put news companies in a tough position financially. The limited resources that news companies can allocate have been put into ‘hot’ fields like social media and video. A good number of journalists are eager to learn new skills but they don’t get much support to pick up new skills and put those skills into use. I wish technology was an issue in Malaysia. We don’t even have data or interactive team in newsrooms here. I’m the only data journalist in Malaysia.

Yolanda Ma: Talent is an issue everywhere, but the challenge beyond that is the cost — the cost to develop the skills and to maintain such a team in the newsroom. Many data stories in China are now going video or motion graphics as well to stay aligned with consumer trends.

Here is an example of data journalism on TV:


Parcels from Faraway Places (subtitles in English)


How do you overcome these challenges? What creative solutions could we find for them?


Kuek Ser Kuang Keng: How to overcome? I find the main hurdle lies with managers and editors, so I would approach them to provide them a better understanding of data journalism — the potential, impacts and costs, or talent needed. Another good way is to build networks among journalists who share the same interests, so they can support each other, and exchange ideas on how to convince their bosses.

Money is a huge problem in Malaysia. The digital disruption has put news companies in a tough position financially. They want something that can see quick returns, often financially

Eva Constantaras: I think we have to abandon the myth that learning data journalism is ‘fast’, something that can be picked up at a bootcamp. Someone should do a data study of how many data journalists come out of bootcamps. And how many statistically unsound stories came out by the few who did manage to produce a data story.

We want data journalism to be taken seriously so we need a serious approach to capacity building. I have a 200-hour training and production model bringing together journalists, civic hackers, and CSOs with data that has worked in a couple of countries but usually because we found committed journalists who were willing to be the lone data journalist in their newsroom. And we do a lot of outreach and convincing of editors and publishers.


Are there any tested business models (other than grants) for data journalism in developing countries?


Question from Stephen Edward (Astat Consulting, India)

Kuek Ser Kuang Keng: Unfortunately, not that I know of, but you can keep a watch on Katadata, a specialised data business news startup in Indonesia. They will increase their monetisation efforts soon.

Eva Constantaras: The only media outlet in a developing country that really sees a lot of revenuee coming from their data work is Nation Newsplex in Kenya, and part of that is because the Nation Media Group can repurpose the online data content for two different print publications and their television station. It’s still a very small team.


Donor support is also often not well structured. They want to give data reporting grants in countries without data reporters. Or they want to give funding for one-off projects that then die a slow death. It’s expensive to train and sustain a data team and most donors don’t make that investment.

Yolanda Ma: One business model that a newsroom is trying (not proved yet) is the think tank approach — they really specialised in urban data, so by digging into data and finding trends, they can actually provide the product for policy makers, urban design industry, etc.

When one data team do very well within the news organisations — another way to go is to spin off. Caixin’s former data head set up his own company last year and it provides service to other media organisations on data stories production now.

The good thing about spinning off is that you do not need to only do journalism projects — which are usually not that profitable. But by being independent you can do commercial projects as well.

Eva Constantaras: The nice thing about spinning off is also then data content can be distributed through a variety of popular media and reach a larger audience.


What can we do to get more high quality data journalism projects from the Global South? And, given that it is harder for the Global South to compete with the Global North, is there a way to build more recognition for the south?


Question from Ben Colmery (ICFJ Knigt Felllowships director, USA)

Yolanda Ma: There are some quite high quality data journalism projects in the South and they don’t have to compete with the North.

Kuek Ser Kuang Keng: As I mentioned earlier, there are far less reporting about the innovations including data journalism projects done by news organisation in Asia. We don’t have Nieman Lab or Poynter here (fortunately we still have djchina.org but it is in Chinese). There are good projects, often done in tough environment, but they don’t get much attention outside of their own country. I can see more and more projects from Latin America were featured in journalism portals but that kind of treatment has not reached Asia. However, language remains a challenge.

Eva Constantaras: I am not sure why they would need to compete since they have different audiences. Though one revenue model I am very interested in is encouraging Western media outlets to buy content from data journalists in the Global South instead of parachutting in their own expensive journalists who do superficial stories.

I think now the West has realized that it needs to do more data-driven reporting on the local level for rural and less educated audiences about issues they care about. I think that the value of data journalism in developing countries is exposing the roots of inequality and helping citizens make better decisions and push for a more accountable government on a local level. Those projects don’t have to be flashy. They just have to be effective and accurate.

Darren Long: I think what international news outlets do well is broad comparative visualisations based around strong concepts. I think we tend to over rely on charts and graphics in Asia.

What is interesting right now is how a market like China has incredibly deep reach through mobile phones. Massive markets do everything on their phone. The tier one cities are easily as sophisticated as the West in that area.

So if we can leverage consumption of dataviz on mobile there should be a massive appetite


Can you share one tip you wish you’d been given about data journalism in the region you work in?


Yolanda Ma: I’d say, in Asia, do start looking for opportunities for cross-border data stories.

Eva Constantaras: Identify questions that citizens need answered to improve their quality of life and build your data stories around answering those questions.

Kuek Ser Kuang Keng: Data journalism takes time and patience. Visualisation is usually the quickest and easiest part!

Yolanda Ma: To echo Eva’s point — yes, don’t just produce meaningless fancy visuals.


Examples of data journalism from around the world that you should go and check out:


Darren Long: The Singapore Reuters office is producing some stunning multimedia data visualisations.

Here’s one they did on the oil spill off China:


But they have international resources and can recruit from all over the world

Here’s an example of a story we did at South China Morning Post. The data was from the government, but they didn’t like the story. If you click on our source, the page opens with a great big disclaimer they added after we didnt take our page down:


The map itself is still up:


A few more that I like:


Kuek Ser Kuang Keng: Tempo is a highly respectable magazine in Indonesia that produces great investigative reports. But most of their data journalism projects are on print. Here’s a deck shared by their editor-in-chief that showcase some of their data stories.


Malaysiakini is also working hard in data journalism. I recently collaborated with them to produce the first newsgame in Malaysia. It explains the issue of malapportionment in Malaysian election system.


Yolanda Ma: Here is a deck I made on data journalism in China a year ago — it serves as a good overview for anyone who’s interested:


Other organisations from China you should check out: Caixin, the Paper/SixthTone, Yicai, DT.

I like IndiaSpend in India and Katadata in Indonesia too.

Eva Constantaras: Here’s an example of a story that might have been risky without government data:


Some of my favourites are IndiaSpend and Hindustan Times in India, Daily Nation Newsplex in Kenya, Ojo Publico in Peru and both La Nacion Argentia and Costa Rica.

Kuek Ser Kuang Keng: I agree with Yolanda and Eva, at the reporter level, a good number of journalists are eager to learn a new skill but they don’t get much support from editors or managers to pick up new skills and put those skills into use.

I would recommend Rappler in the Philippines, Katadata and Tempo in Indonesia. But only Katadata has a dedicated vertical for data stories


To see the full discussion, check out previous ones and take part in future ones, join the Data Journalism Awards community on Slack!

Over the past six years, the Global Editors Network has organised the Data Journalism Awards competition to celebrate and credit outstanding work in the field of data-driven journalism worldwide. To see the full list of winners, read about the categories, join the competition yourself, go to our website.


marianne-bouchart

Marianne Bouchart is the founder and director of HEI-DA, a nonprofit organisation promoting news innovation, the future of data journalism and open data. She runs data journalism programmes in various regions around the world as well as HEI-DA’s Sensor Journalism Toolkit project and manages the Data Journalism Awards competition.

Before launching HEI-DA, Marianne spent 10 years in London where she worked as a web producer, data journalism and graphics editor for Bloomberg News, amongst others. She created the Data Journalism Blog in 2011 and gives lectures at journalism schools, in the UK and in France.

Counting crime: How journalists make sense of police data

This article was originally published on the Data Journalism Awards Medium Publication managed by the Global Editors Network. You can find the original version right here.

___________________________________________________________________________________________________________________


Takeaways from a discussion with experts behind two of the most compelling data projects tackling crime in the US


As a journalist, how do you go about accessing, verifying and visualising datasets on crime and police?


Accessing crime and police data is crucial given the amount of shootings and police violence brought into the headlines through cases like Freddy Gray and Philando Castile.

As a journalist, how do you go about accessing, verifying, and visualising datasets on this topic? What kind of ethical questions does that raise? How do you protect the victims? We gathered experts to find out.


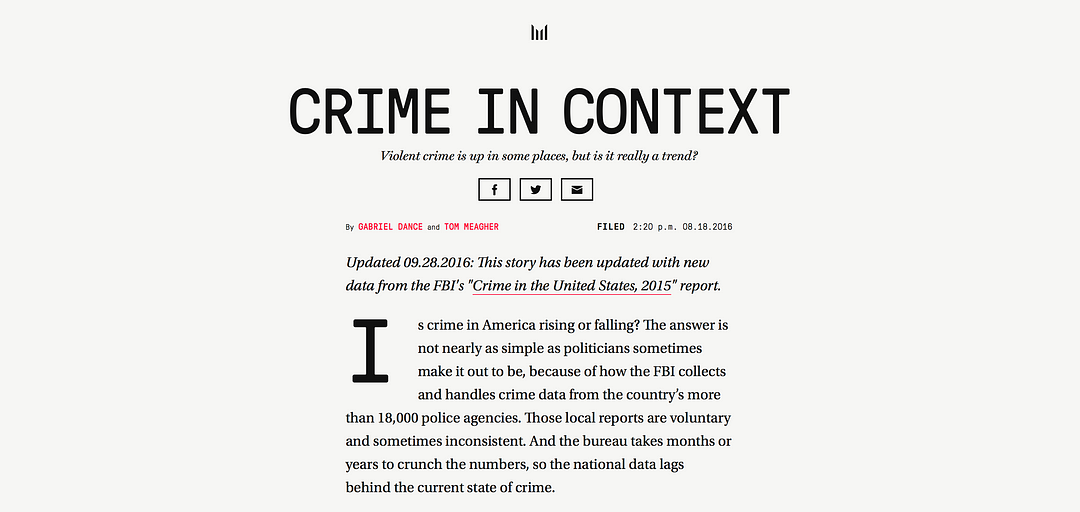
Is crime in America rising or falling? The answer is not nearly as simple as politicians sometimes make it out to be.


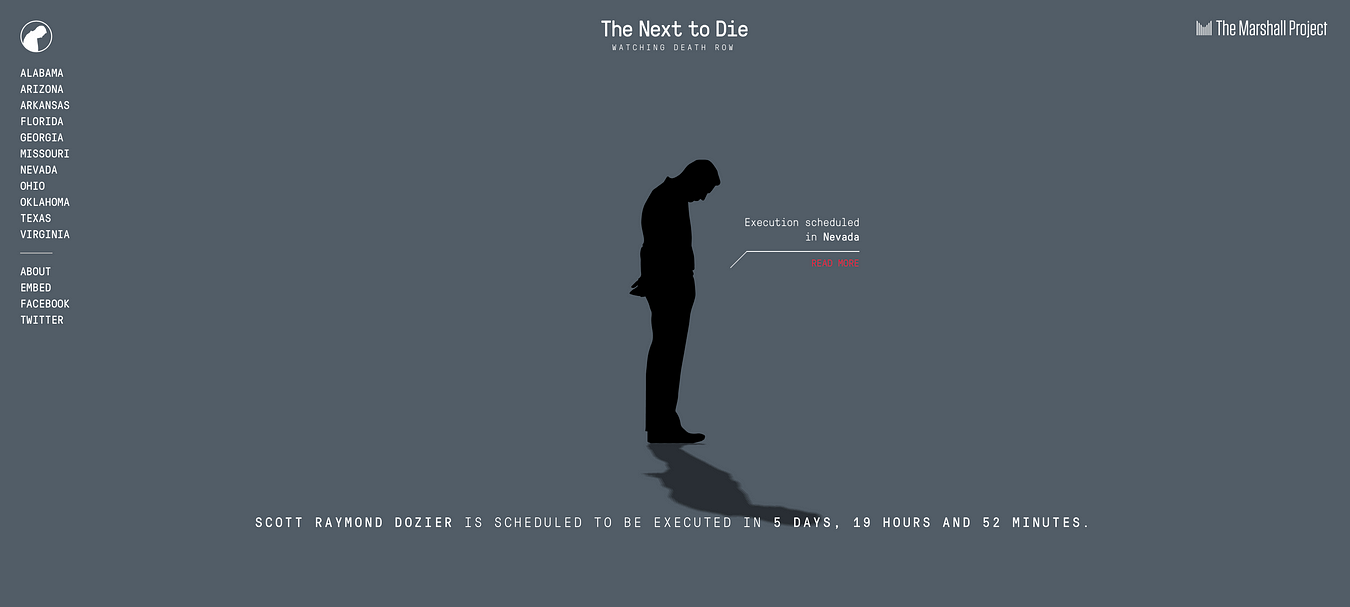
Tom Meagher is deputy managing editor for The Marshall Project which has been publishing some of the most compelling crime data journalism of the past few years. Their project Crime in Context won a Data Journalism Awards 2017 prize for its analysis of 40 years worth of national and local crime data. The Next to Die has been tracking every execution in the US for the last two years in close to real time.

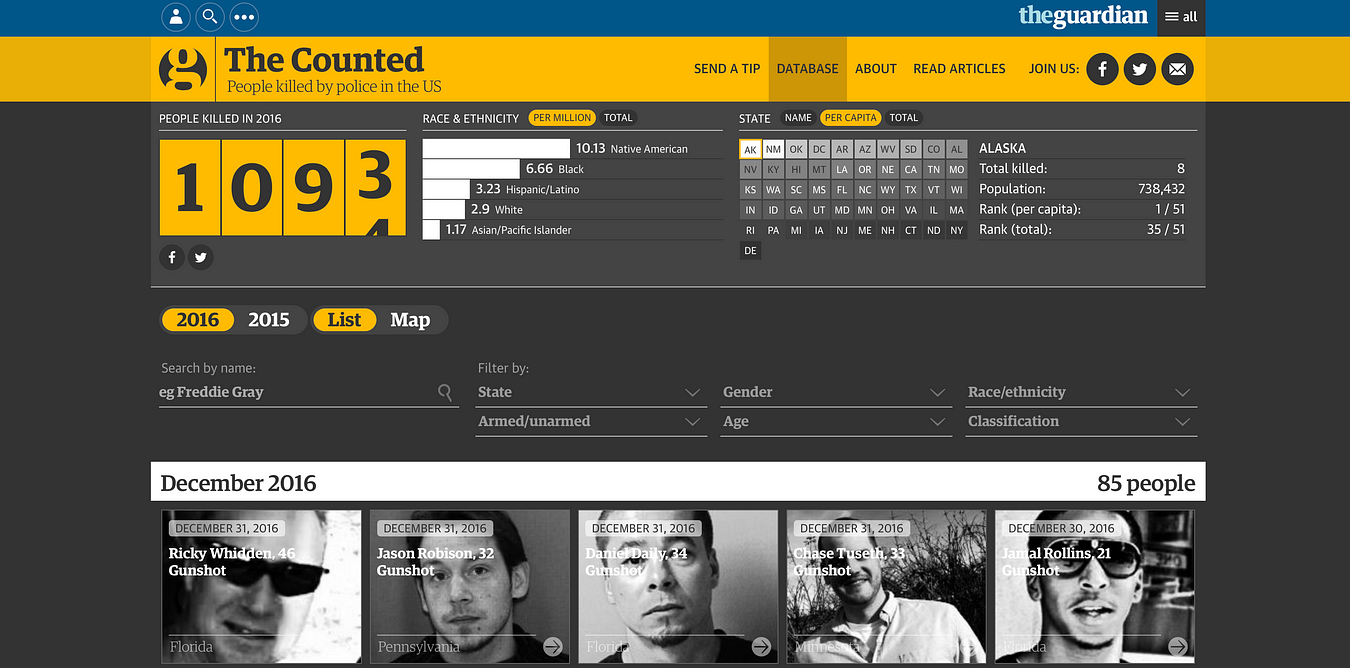
Ciara McCarthy is a journalist who worked on Guardian US’s The Counted project, often referred to as an industry benchmark. It counts the number of people killed by police and other law enforcement agencies in the US throughout 2015 and 2016 to monitor their demographics and to tell the stories of how they died.

Both of them joined us during a Slack discussion dedicated to crime and police data at the beginning of November. This article gathers the best tips and advice they dared to share.


The Counted is the most thorough public accounting for deadly use of force in the US


What makes working with crime or police data different from working with any other type of data?


Tom Meagher: Oh, where to begin? In the US, there are a few things that make criminal justice data a little more complicated than in most other beats. First, there’s a presumption of innocence for people accused of crimes until their case works its way through the court systems. So we want to be mindful of how the people our data represents are considered. Not everyone arrested is guilty, but with data it can be easy to overlook that key fact sometimes.

And more practically, in the US the data is so, so fragmented. There are 18,000+ police agencies and thousands of courts that all seem to keep their data in their own way (if they keep it at all). It makes it really challenging to carry out national analyses of how parts of the criminal justice system are operating. There are very few one-stop-shops for data.

Ciara McCarthy: I think, for us at The Counted at least, the main issue we set out to fix was that the data we wanted to analyse and investigate simply didn’t exist. There was no comprehensive or reliable information about how many people died in police custody in the US (although there is lots of available data, of varying reliability, about other pieces of the criminal justice system).

I think that a lot of criminal justice data […] might not be complete or accurate if it’s even been collected. And to echo Tom, that’s the other main issue: With no central body keeping track of the data we were looking at, it was hard to monitor thousands of different law enforcement agencies, all of which follow slightly different policies and standards for releasing information and communicating with reporters.

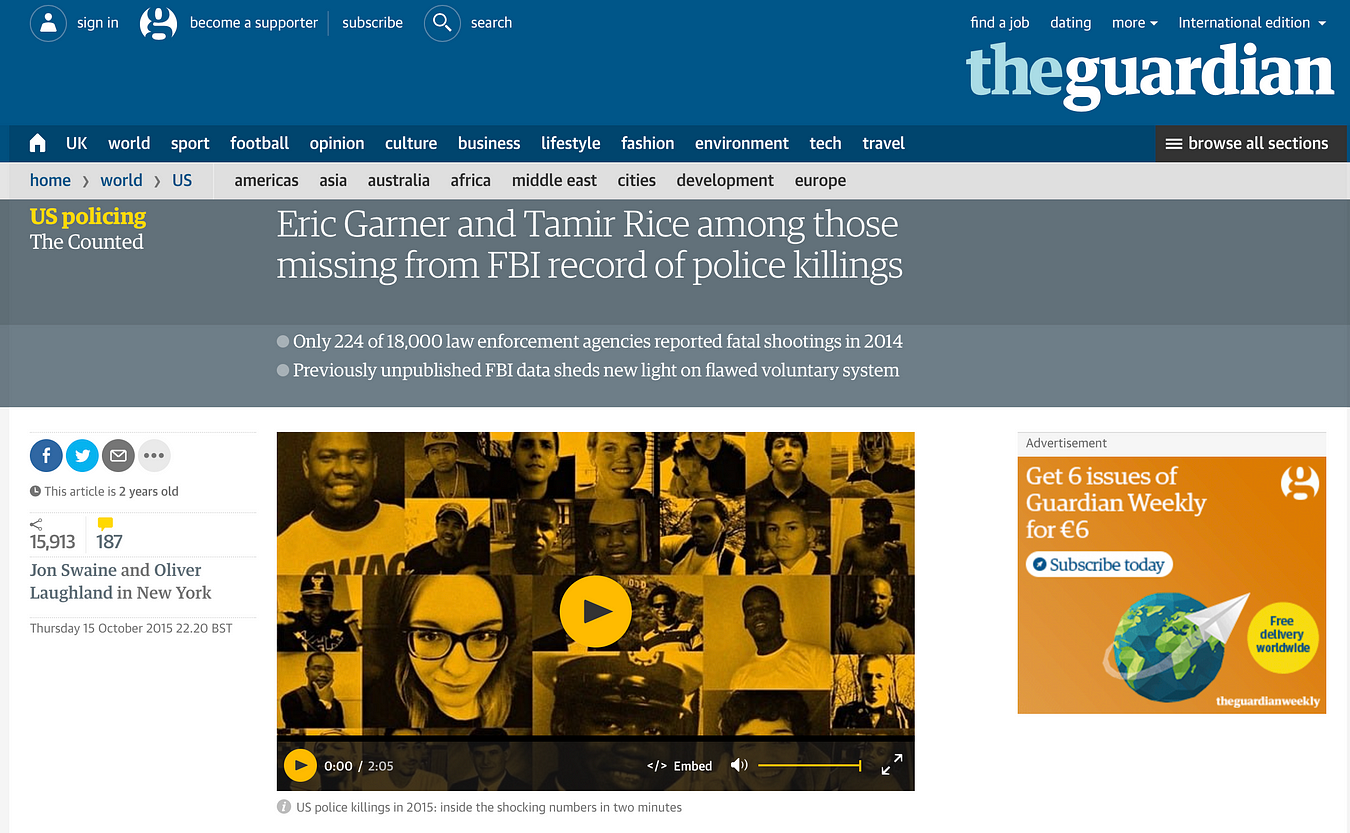
Although the FBI ‘collects’ this data, it’s wildly inaccurate, and underestimates the true number of people who die in police custody at least by half. It’s optional for police departments to submit their information to the FBI, meaning that most don’t end up doing it.


Previously unpublished data revealed only 224 of 18,000 US law enforcement agencies reported fatal shootings in 2014 sheds new light on flawed system


So would your advice be to ‘build your own data’?


Ciara McCarthy: I think it depends! Once our team started reporting on this issue in particular, it was clear that, at least for deaths in custody, the information the federal government had would have resulted in deeply flawed analyses. But in other areas of the US criminal justice system, the data collected by the government is usable — I think it’s a matter of asking a lot of questions of an available data set before you get started and seeing whether you can make reliable analyses. And if you can’t, then yes! Build your own data.

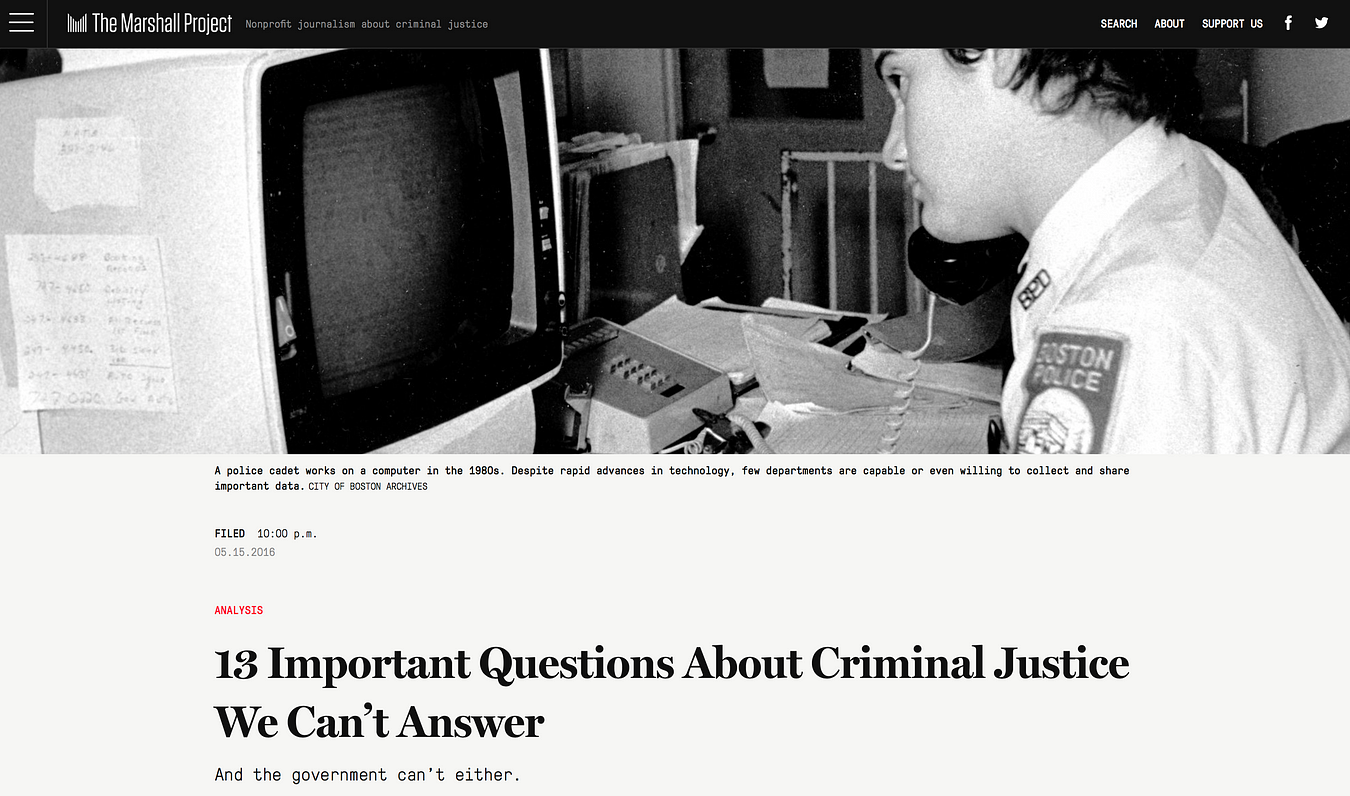
Tom Meagher: It seems like at The Marshall Project, for nearly every significant investigative story we do, the data doesn’t exist. We have to build it ourselves. As an example, here’s a story I wrote about just a few of the really key criminal justice questions we can’t answer in the US because the data doesn’t exist.


After the deaths of Freddie Gray and Laquan McDonald and others — in an age when police in many cities are under greater scrutiny than they’ve been in decades — how is it that we know so little about how officers employ force to subdue suspects?


As data is tough to get hold of, do you have tips on how or WHERE to find crime and police data?


Tom Meagher: When we’re approaching a story, we have to craft a new strategy every time. For Crime in Context, we had a trove of 40+ years of the federal Uniform Crime Reporting data, but then we had to go back and contact individual police agencies to fill in dozens and dozens of holes we identified.

Then we had to call 70+ police agencies to get them to release the previous year’s data (this was in August) because the FBI didn’t have it yet. We could flag missing records in the data or reports that were suspicious (how could they have -30 assaults in a month?) and had to report each of those out. My friend Steven Rich at the Washington Post likes to say ‘the phone is the most important tool for data journalism’.

Ciara McCarthy: For us at The Counted we basically went from agency to agency to request and ask for the data. Sometimes we had to request the information under public records law, and sometimes the information (or the basics, at least) were easily distributed. The Counted was a little different from some data analysis projects in that it was live: We added new cases of people killed by police to the database each day.


How do you verify data related to crime and the police, especially when victims come forward to denounce wrongdoing? Any tips or best practice on crowdsourcing for such projects, and establishing trust with sources?


Tom Meagher: We tend to rely on official court records — lawsuit filings, courtroom testimony, decisions — and on other journalists to help us vet information. Our executions project, The Next to Die, is a sort of journalistic crowdsourcing, where we work with reporters and editors in eight other news organisations to help us amass the information that goes into our database.


The Next to Die aims to bring attention, and thus accountability, to upcoming executions.


Ciara McCarthy: A few things I’d point out from our project: First, for us, when we couldn’t give a definitive answer, we noted it (see an example right here). I think part of the genius behind our very brilliant interactive journalists who built the database was they created one that could adapt to our reporting needs as we added to the database.

So if police said someone was armed with a knife, but witnesses said the person had dropped the knife before the shooting, we usually label that ‘disputed’ in our database, and then pursue additional information to try and get a clear answer. In cases of people killed by police, the first piece of information almost always comes from authorities, and that information may or may not be true. So if there are witnesses (often there aren’t) we’ll talk to them to see if they saw something different.

Secondly, we considered The Counted to be a crowdsourced database, meaning that our readers could reach out and contact us with tips at any time. We had a ‘tip line’ of sorts on our website and we also got information from readers via Facebook, Twitter, and email. Most of the time, the people reaching out to us weren’t sources with sensitive or story-cracking information, but readers with questions about the project or people alerting us to new cases. Sometimes, though, family members of the deceased would reach out to dispute law enforcement’s characterisation of the incident, and when that happened we’d follow up on whatever information they gave us.


The Guardian US had a “tip line” on their website and also got information from readers via Facebook, Twitter and via email


Have you ever been worried of the backlash or bad impact your projects could have?


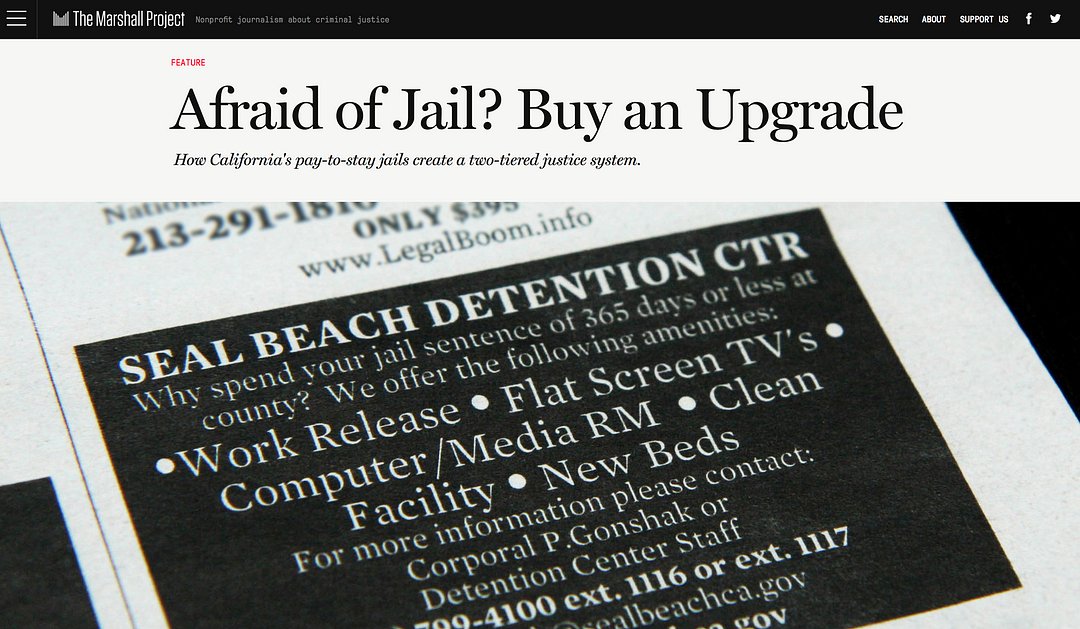
Tom Meagher: We try to operate in a ‘no surprises’ manner. We go to great lengths to let our subjects know what’s coming out and to give them an opportunity to respond ahead of time. A big story my colleagues undertook on these programmes where you can pay money to stay in safer or nicer jails relied heavily on freedom of information requests and data compiled from more than 25 different police jurisdictions (screenshot below). If you look at the methodology, they describe how they did the analysis and how they took it to each of those police agencies a few weeks before publication to give them a chance to dispute or comment on the analysis.


In what is commonly called “pay-to-stay” or “private jail,” a constellation of small city jails — at least 26 of them in Los Angeles and Orange counties — open their doors to defendants who can afford the option


As far as protecting sources from legal or physical harm, we’re very mindful of that. We go to great lengths to get our sources to go on the record, but if we think they’re potentially in jeopardy, we will allow them to be anonymous, provided we can vet their story independently. We don’t want to put anyone at risk of losing their jobs or of physical harm.

Ciara McCarthy: No one on our team personally encountered any threats or danger as a result of The Counted project as far as I know; I’d say the worst I personally encountered was a few mean tweets and a few terse phone calls with law enforcement officials who weren’t happy about the project. We also didn’t have a ton of anonymous sources whose identity we needed to protect (which I don’t think is something we expected starting out).

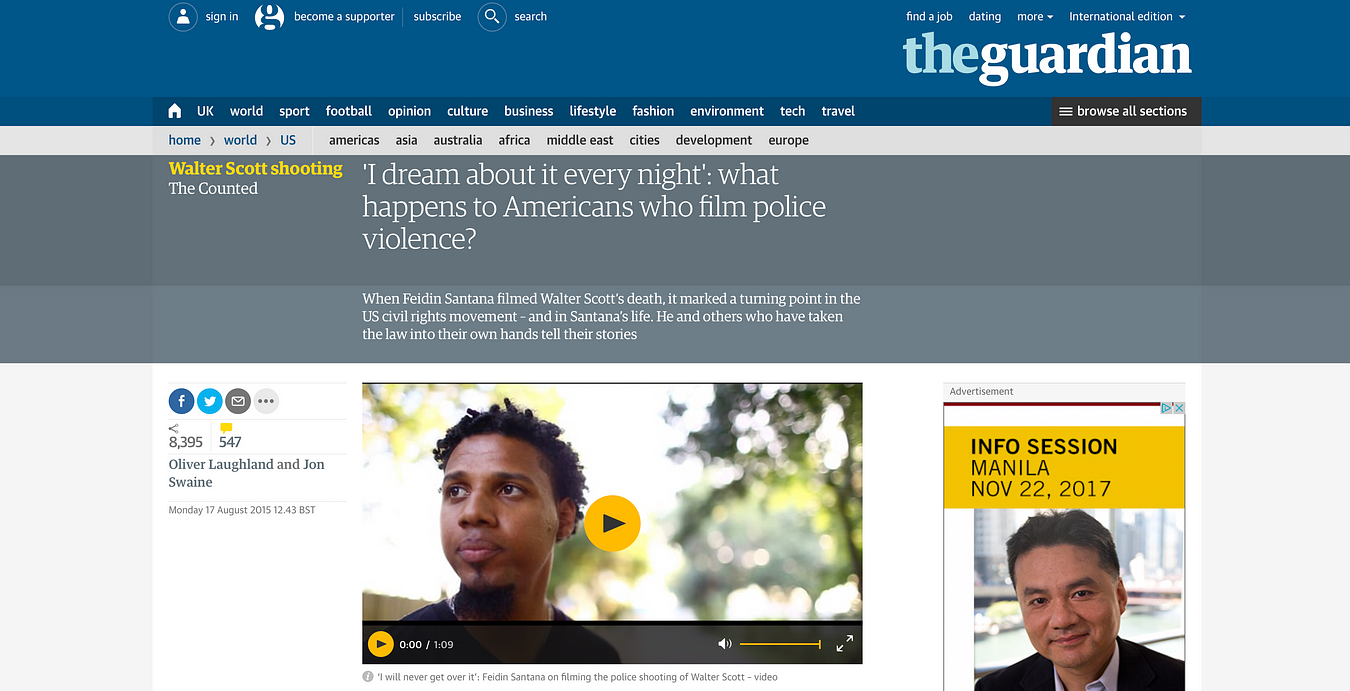
Most of the time, if witnesses or family members contradicted the police account, these (very brave) people did so pretty publicly. See, for example this article (screenshot below) telling the story of an American who filmed police violence. If there were cases where our reporters were working with anonymous sources, they were very cautious and made sure those who were providing information knew what publishing their accounts entailed.


When Feidin Santana filmed Walter Scott’s death, it marked a turning point in the US civil rights movement — and in Santana’s life. He and others who have taken the law into their own hands tell their stories


Do you encounter difficulties in streamlining key definitions (for example ‘armed’ vs ‘unarmed’, or ‘Police custody’), especially when gathering data from multiple sources? How do you resolve these differences?


Tom Meagher: Oh yes, all the time. We find that different agencies or different states will often use the same words but have completely different meanings. In one state, for example, they may have a crime called ‘battery’ that in a different state would be labelled ‘assault’. We first try to make sure that we understand exactly what each term means to each source. We start with getting their data dictionary (or record layout or user’s manual) to see how they define it in print. Then we’ll follow up with interviews with agency personnel to confirm our understanding of the terms. Ultimately, we’ll often create our own categorization scheme that is hopefully more accessible to readers to describe each class of records we see in the data.

In the Pay to Stay story, we had 25+ agencies all using different terms to refer to a fairly arcane set of state statutes that you really needed a law degree to understand. With lots of reporting work, we were able to generally class them as types of crimes with colloquial names (Drugs, Driving Violations) that were still accurate to the legal definitions, muddled as they were. It ultimately made it easier for our readers to grasp the importance of the different types of crimes being reported on.

“Often in data reporting, it’s tempting to be lulled into thinking that the ‘official data’ that is provided to you is rational and sensible and ready to be analyzed or visualized. In reality, we find most of the time that it’s a complete mess that requires a lot of reporting before we can even think about analyzing it to inform our reporting.” Tom Meagher (The Marshall Project)

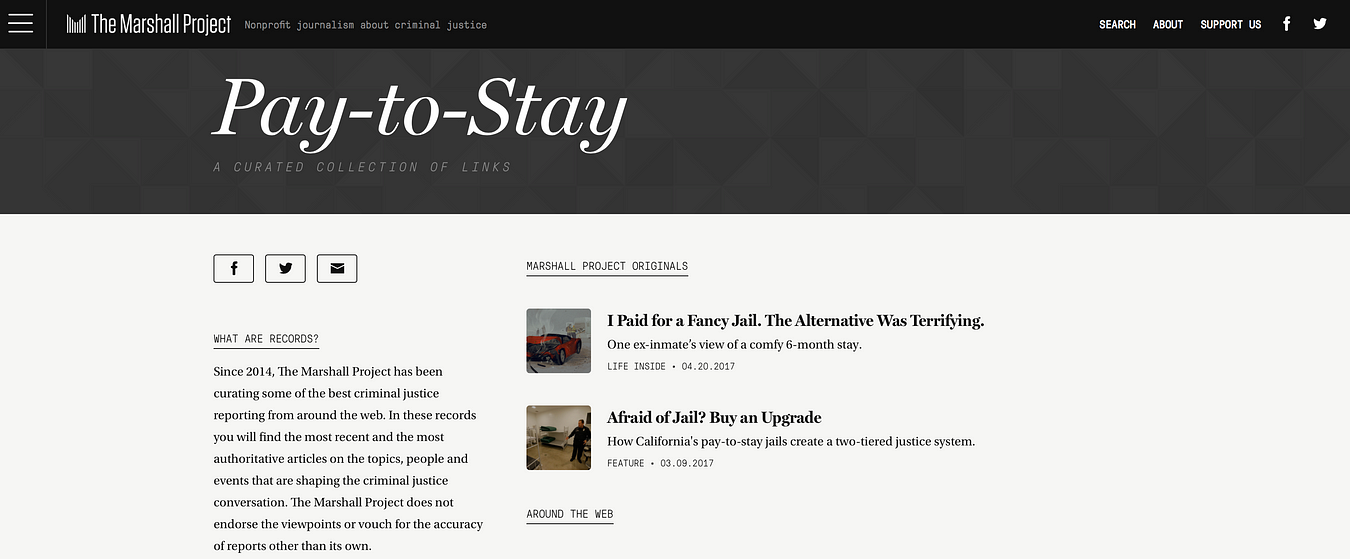
Pay-to-stay is a curated collection of links by The Marshall Project, part of their Records project


Ciara McCarthy: We ran into this issue A LOT while working on The Counted project, particularly when it came to defining whether the deceased was armed or unarmed, as you noted. As you can imagine, the law enforcement definition of someone who is armed might differ from what others would consider armed, or the police account might change over time. We ran into this a lot when police shot and killed someone who was driving a car; often, they would say, they opened fire because the person in question was using the car as a weapon. (We did a bigger piece on this here).

That’s obviously super tricky, because it’s difficult to corroborate without video or a witness. A good example of this issue is the case of Zachary Hammond, a teenager who was shot and killed in South Carolina in 2015. Police initially said he drove the car toward the officers, which is why one opened fire. Surveillance footage released later showed that Hammond was driving past the officer, and not directly at him.

So I don’t have an easy answer! Sometimes the only available info we had was from police, but we’d do our best to find other sources when the police account seemed questionable. Basically, it meant a lot of extra reporting and a lot of discussions among our team members.


What tips do you have on visualising crime and police data? How and why do you decide whether or not to show people’s name, photo, or personal information?


Ciara McCarthy: With The Counted, we had built this big database, and wanted people to be able to use it and explore it and learn from it. That’s a main reason why the database included photos, whenever possible: We really wanted to put a face on each person who had died, so we weren’t only focusing on the overall number of people who died.

As for personal information, we would include what was relevant; so, for example, if a person’s medical or mental health history might have impacted their interaction with authorities, we’d be sure to note that.


For regular updates from The Next to Die, follow @thenexttodie on Twitter


Tom Meagher’s tips:

  • You want to give your data context.
  • Avoid one-year comparisons.
  • Set it against historical data as much as possible.
  • As you visualize it, try to remember that every record in that database represents a person — someone who was injured or victimized or killed, or someone who has committed crimes.
  • Try to use your visualization to emphasize their humanity as much as you can. Dots or jagged lines sometimes obscure the people they represent


Is there one thing you wish someone had told you before you took on The Counted and the Next To Die projects?


Tom Meagher: Building your own databases for open-ended projects can be very fulfilling as a journalist. You’re filling a gap in the public’s understanding of an issue. It’s very worthy. But also keep in mind that you’re committing your news organization to an endless project.

Does the story merit your time and your colleagues’ time for the indefinite future? I’d argue that The Counted and the Next to Die do. But you don’t want to make the decision without understanding the costs and all the other reporting you won’t be able to do for the next few years because you’ll have to be updating your database.

Also, these can be very emotionally taxing subjects to report on. You’re spending your entire professional life (and much of your personal life) immersed in stories of violence, and trauma, and misery. Be sure to take care of yourself and give yourself emotional outlets.


What do you think could be done to improve things? Do we just need more comprehensive data from authorities compiled in a standardised way?


Tom Meagher: The division of powers between local and state and federal governments in the US makes it complicated. There’s realistically not going to ever be a single source for reliable data. What would be a vast improvement would be if more politicians and policymakers embraced the ideas of transparency and accountability, that better, smarter data will help them and the public understand our justice systems, and to make better decisions.

As journalists, we’d certainly benefit from that change in mindset, which is still too rare here.

Ciara McCarthy: It would be lovely to get more comprehensive data, but perhaps that’s just wishful thinking. I think getting data from a variety of sources and different types of data will help — comparing a database of media reports vs. official data, for example. That’s what my team is doing with our project, anyway.

More comprehensive data from authorities would be amazing, of course, but when that’s not an option I think building your project is a great public service for newsrooms to undertake. One of my favourite things about The Counted was that, on the surface, it’s mission and premise was pretty simple: The US government should know how many people are killed by police each year. We don’t, so let’s change that.

There’s obviously a ton of different reporting that can (and should!) be done on issues related to police violence, but one thing I really liked about our project was that, at the heart of it, we were saying that we can’t have this public policy discussion without reliable data. I think having this specific, and sometimes narrow, aim for big journalism projects can be really clarifying, and help you achieve impact.


How does it compare in other parts of the world?


Aun Qi Koh of Malaysiakini (Malaysia): I feel like it’s the opposite problem in Malaysia as the official data comes from just one source, the Interior Ministry/Royal Malaysian Police, but it’s not very detailed, and unfortunately we don’t have many other sources of data because there aren’t many checks and balances on the police.


Shree D N of Citizen Matters (India): India has the problem of under-reporting crime data. The National Crime Records Bureau is the official data source, but underreporting usually happens. This article has some insights on the issue. The methodology used to record offences leads to under-reporting of rape, abduction and stalking.


Eva Constantaras is a data journalist and trainer who recently wrote the Data Journalism Manual for the UN Development Program.


During our November Slack discussion she shared with us great examples from Kenya, Afghanistan and Turkey:

“I think The Counted inspired so many other media outlets because they realized they could build their own databases using similar data collection techniques but getting away from official sources. The Kenya Nation Newsplex team used mostly media reports to compile its Deadly Force Database.

Pajhwok Afghan News maintains a database of terrorist attacks that is much more detailed than anything the government or international bodies maintain. It’s not too much work because they cover all terrorist attacks anyway so they just have to enter them into the database. And then they can generate monthly stories on trends in terrorism in Kabul and across Afghanistan without too much effort.

This paper on collaboration between civic tech and data journalists I think is also relevant. In Turkey, Dag Media works with a domestic violence NGO to track violence against women. The NGO builds the database and the journalists do the stories.”


To see the full discussion, check out previous ones and take part in future ones, join the Data Journalism Awards community on Slack!

Over the past six years, the Global Editors Network has organised the Data Journalism Awards competition to celebrate and credit outstanding work in the field of data-driven journalism worldwide. To see the full list of winners, read about the categories, join the competition yourself, go to our website.

 

A Case for Open Data in Transit [VIDEO]


STREET FILMS – by Elizabeth Press

Ever find yourself waiting for the next bus, not knowing when it will arrive? Think it would be great if you could check a subway countdown clock from the sidewalk? Or get arrival times on your phone? Giving transit riders better information can make riding the bus or the train more convenient and appealing. And transit agencies are finding that the easiest and least expensive way to do it is by opening data about routes, schedules, and real-time locations to software developers, instead of guarding it like a proprietary secret. [Read more…]


Groundbreaking data tracks carbon emissions back to their source

THE GUARDIAN’S ENVIRONMENT BLOG – By 

A new scientific paper allows us to see which countries extracted the fossil fuels burned to support lifestyles in other countries

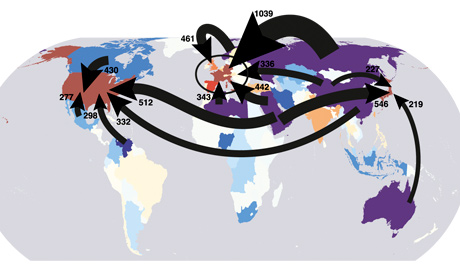
Overview of carbon flows from fossil fuel extraction to the final consumers of goods and services

 
Which of the following accounts for the largest share of the UK’s carbon footprint? All our holiday flights, all the power used in our homes or … Russia?

Okay, so it’s kind of a trick question, but according to a scientific paper published this week, we might reasonably conclude that the answer is Russia – though to understand why it’s necessary to go back a couple of steps.

For the purposes of the Kyoto treaty, a nation’s carbon footprint is considered to be a sum of all the greenhouse gas released within its borders. But as many people – myself included – have been pointing out for years, that approach ignores all the laptops, leggings, lampshades and other goods that rich countries import from China and elsewhere.

If we want any chance of a fair global climate deal, the now-familiar argument goes, we need to rethink the way we measure emissions to allocate some of the carbon pouring out of Chinese, Indian and Mexican factories and power plants to the countries importing good from those countries.

The new scientific paper, published in the Proceedings of the National Academy of Sciences, points out that this argument – though persuasive – tells only half of the story. If you want to understand how carbon footprints are affected by international trade flows, the paper argues, you need to consider trade not only in gadgets and garments but also in fossil fuels themselves. After all, though country X might import a television that was made in country Y, it’s quite possible that country Y in turn imported some of the coal, oil or gas consumed by the television factory from country Z. [Read more…]


Strata Summit 2011: The US Government’s Big Data Opportunity [VIDEO]

So the Strata Summit happened last week and blew our data minds with new ideas and incredible speeches from the best people in the data world. One of the highlights we particularly liked was the conversation about the future of open government data in the US.

Here is a video where Aneesh Chopra, the US Federal Chief Technology Officer, deputy CTO Chris Vein, and Tim O’Reilly, founder and CEO of O’Reilly Media, discuss Obama’s latest visit to New York and the opportunities that big datasets could set for the future…

[youtube 4wdkk9B7qec]

More info on the speakers (from O’Reilly website):

Photo of Aneesh Chopra

Aneesh Chopra

Federal Office of Science and Technology Policy

Chopra serves as the Federal Chief Technology Officer. In this role, Chopra promotes technological innovation to help the country meet its goals from job creation, to reducing health-care costs, to protecting the homeland. Prior to his confirmation, he served as Virginia’s Secretary of Technology. He lead the Commonwealth’s strategy to effectively leverage technology in government reform, to promote Virginia’s innovation agenda, and to foster technology-related economic development. Previously, he worked as Managing Director with the Advisory Board Company, leading the firm’s Financial Leadership Council and the Working Council for Health Plan Executives.

Photo of Chris Vein

Chris Vein

Office of Science and Technology Policy

Chris Vein is the Deputy U.S. Chief Technology Officer for Government Innovation in the White House Office of Science and Technology Policy. In this role, Chris searches for those with transformative ideas, convenes those inside and outside government to explore and test them, and catalyzes the results into a national action plan. .Prior to joining the White House, Chris was the Chief Information Officer (CIO) for the City and County of San Francisco (City) where he led the City in becoming a national force in the application of new media platforms, use of open source applications, creation of new models for expanding digital inclusion, emphasizing “green” technology, and transforming government. This year, Chris was again named to the top 50 public sector CIOs by InformationWeek Magazine. He has been named to Government Technology Magazine’s Top 25: Dreamers, Doers, and Drivers and honored as the Community Broadband Visionary of the Year by the National Association of Telecommunications Officers and Advisors (NATOA). Chris is a sought-after commentator and speaker, quoted in a wide range of news sources from the Economist to Inc. Magazine. In past work lives, Chris has worked in the public sector at Science Applications International Corporation (SAIC), for the American Psychological Association, and in a nonpolitical role, at the White House supporting three Presidents of the United States.

Photo of Tim O'Reilly

Tim O’Reilly

O’Reilly Media, Inc.

Tim O’Reilly is the founder and CEO of O’Reilly Media, Inc., thought by many to be the best computer book publisher in the world. O’Reilly Media also hosts conferences on technology topics, including the O’Reilly Open Source Convention, the Web 2.0 SummitStrata: The Business of Data, and many others. O’Reilly’s Make: magazine and Maker Faire has been compared to the West Coast Computer Faire, which launched the personal computer revolution. Tim’s blog, O’Reilly Radar, “watches the alpha geeks” to determine emerging technology trends, and serves as a platform for advocacy about issues of importance to the technical community. Tim is also a partner atO’Reilly AlphaTech Ventures, O’Reilly’s early stage venture firm, and is on the board of Safari Books Online.

Opening the data, with Rufus Pollock [AUDIO]

Rufus Pollock is the co-founder of the Open Knowledge Foundation. He spent the past few months travelling across Europe to promote the raise of open data and to make people aware that they need more of it as well as more transparency from their government and big organisations.

We met with him in the busy Hub in London to ask him why this “data openness” isn’t widespread yet…

[audio:https://www.datajournalismblog.com/wp-content/uploads/2011/05/Rufus-Pollock-for-DJB1.mp3|titles=Rufus Pollock for DJB1]