Newspapers which tend to primarily focus on local issues, often represent the majority of media outlets in each country’s media landscape. They deliver a number of important journalistic functions, like holding local authorities to account, supporting democratic and civic needs and shaping the overall reputation of journalism. Thanks to their powerful human interest reporting, they shine a spotlight on local issues and offer unique local content that is is not necessarily found elsewhere.
As co-funder of the startup Urbs Media and director of the RADAR project, Alan Renwick has over 30 years experience in local, national and international news industries. Within his work, he provides local newsrooms with a regular feed of data-driven stories and scale up local news production by combining the work of journalists and Artificial Intelligence.
In this interview, he tells us why local journalists should not hesitate to use data within their work and how to turn national datasets into local content:
How can local journalists use data in their reporting?
There are many things that local journalists can do with data journalism. They already have their own data journalism efforts, like their own datasets, they are investigating their own local issues, and they have a lot of unique content. It is all just starting on a national level with national datasets but after that, local journalists have to unlock the fact that these datasets have got a lot of local information within them and can be used complementary to anything else they are doing. So they might put some local interviews around it or make some analysis and build it up in a much more colourful, local story.
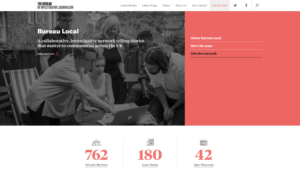
The Bureau Local is a collaborative, investigative journalism network in the UK which stands as a great example of how data journalism is thriving
You are the director of RADAR (Reports And Data And Robots), a news agency that combines humans and machines to deliver data-based news stories to local newsrooms. How can local journalists make use of those stories?
What we do with RADAR is to hopefully give those local newsrooms skills and raw material to work with. This comes in form of a regular feed of data- driven stories for that they might normally not have the time and resources to look at. The reason for that is that most of them have quite a high philosophy behind them and there is a high number of data stories around.
So, what we actually do then is to take national datasets and do a fusion of local and national journalism. That means, we try to understand the generics of national data and see how these stories might vary for every local area. Then we look at the different variables to figure out how many different outcomes there might be and write story templates for every eventuality. For instance, we might put the numbers from a spreadsheet into a sentence such as “since w, house prices in x have increased by y/fallen by z/stayed the same”. This means that if you have 500 rules you might have 500 different stories. From the same data you might have different types of stories with different headlines and different content.
RADAR is a collaboration between the Press Association and Urbs Media that delivers news stories to local media, combining the work of humans and machines.
What is your top advice for local journalists who want to work with data?
Many local newsrooms want to write very few numbers into their stories even if all the sources come from data. That is why my advice for local journalists is to treat data journalism just like any other source. There might be a broader, softer story that comes from it. They just have to understand the genesis of it, where it comes from, then integrate it, be sure of what it means, what the facts are and then create the story in their very traditional way.
Learn the data skills but as you use them, use them in the way that you would use any other source.
Michaela Gruber is a journalism and media management student, based in Vienna, Austria. During her studies she spent a semester abroad in France, where she started working for HEI-DA.
As the company’s communication officer, she is in charge of the Data Journalism Blog and several social media activities. This year, Michaela was HEI-DA’s editor covering the Data Journalism Awards in Lisbon, Portugal.
Peter Aldhous of BuzzFeed News and Simon Rogers of the Google News Initiative discuss the power of machine learning in journalism, and tell us more about the groundbreaking work they’ve done in the field, dispensing some tips along the way.
Machine learning is a subset of AI and one of the biggest technology revolutions hitting the news industry right now. Many journalists are getting excited about it because of the amount of work they could get done using machine learning algorithms (to scrape, analyse or track data for example). They enable them to do tasks they couldn’t before, but it also raises a lot of questions about ethics and the ‘reliance on robots’.
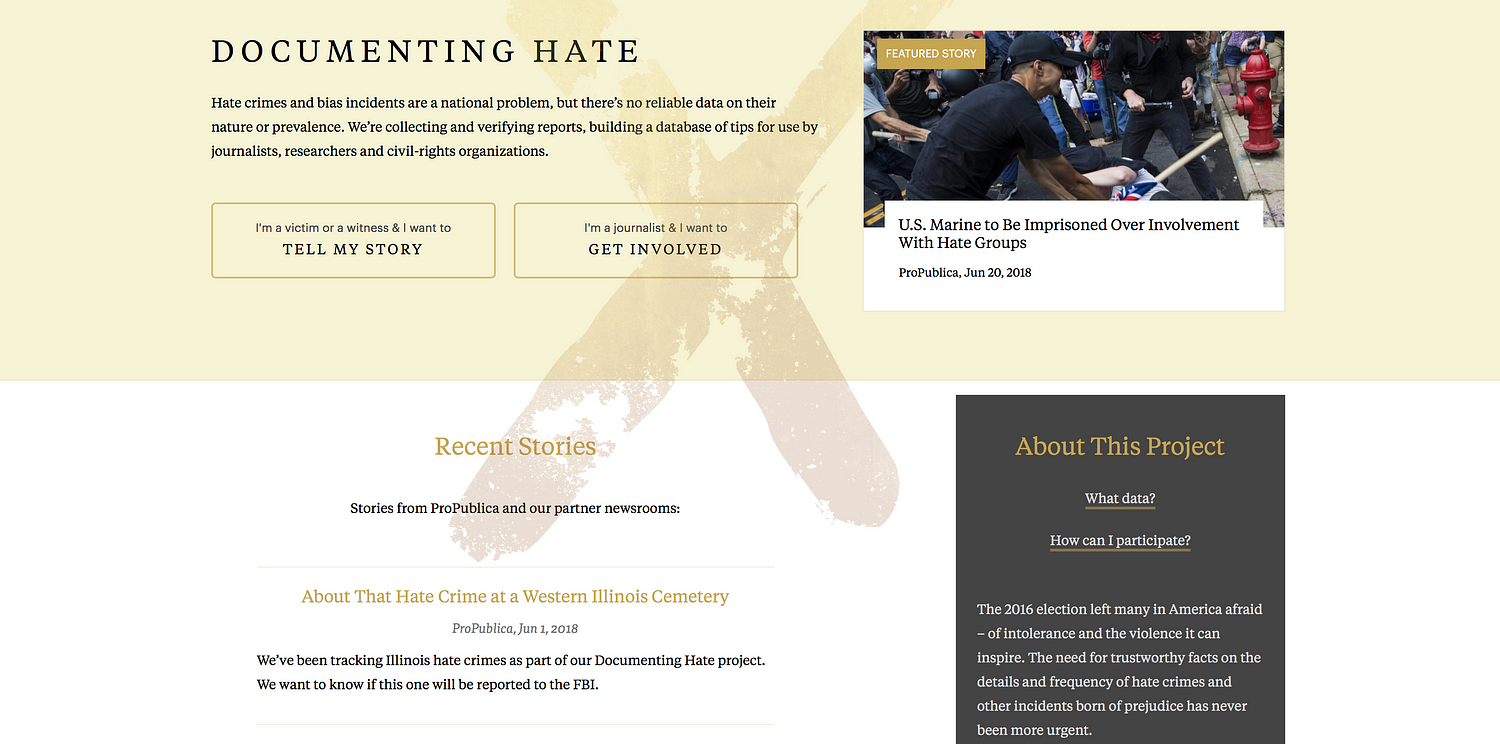
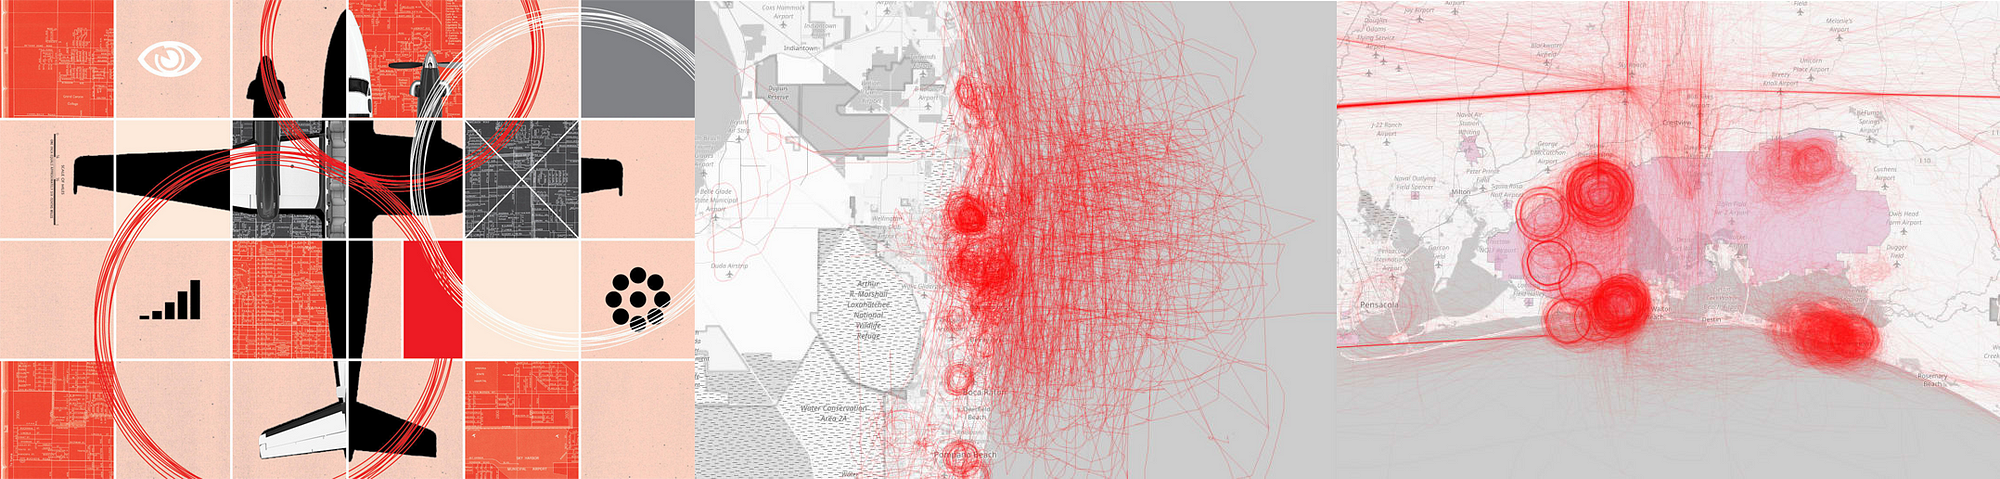
Peter Aldhous is the brain behind BuzzFeed News’s machine learning project ‘Hidden Spy Planes’. The investigation revealed how US airspace is buzzing with surveillance aircraft operated for law enforcement and the military, from planes tracking drug traffickers to those testing new spying technology. Simon Rogers is data editor for Google (who’s also been contributing to some great work on machine learning, including ProPublica’s Documenting Hate project which provides trustworthy facts on the details and frequency of hate crimes).
What is it about AI that gets journalists so interested? How can it be used in data journalism?
Peter Aldhous: I think the term AI is used way too widely, and is mostly used because it sounds very impressive. When you say ‘intelligence’, mostly people think of higher human cognitive functions like holding a conversation, and sci-fi style androids.
But as reporters, we’re often interested in finding the interesting things from a mass of data, text, or images that’s too big to go through manually. That’s something that computers, trained in the right way, can do well.
And I think machine learning is a much more descriptive and less pretentious label for that than AI.
Simon Rogers: There is a big gap between what we’ve been doing and the common perception of self aware machines. I look at it as getting algorithms to do some of the more tedious work.
Why and when should journalists use machine learning?
P.A.: As a reporter, only when it’s the right tool for the job — which likely means not very often. Rachel Shorey of The New York Times was really good on this in our panel on machine learning at the NICAR conference in Chicago in March 2018.
She said things that have solved some problems almost as well as machine learning in a fraction of the time:
– Making a collection of text easily searchable;
– Asking a subject area expert what they actually care about and building a simple filter or keyword alert;
– Using standard statistical sampling techniques.
What kind of ethical/security issues does the use of machine learning in journalism rise?
P.A.: I’m very wary of using machine learning for predictions of future events. I think data journalism got its fingers burned in the 2016 election, failing to stress the uncertainty around the predictions being made.
There’s maybe also a danger that we get dazzled by machine learning, and want to use it because it seems cool, and forget our role as watchdogs reporting on how companies and government agencies are using these tools.
I see much more need for reporting on algorithmic accountability than for reporters using machine learning themselves (although being able to do something makes it easier to understand, and possible to reverse engineer.)
If you can’t explain how your algorithm works to an editor or to your audience, then I think there’s a fundamental problem with transparency.
I’m also wary of the black box aspect of some machine learning approaches, especially neural nets. If you can’t explain how your algorithm works to an editor or to your audience, then I think there’s a fundamental problem with transparency.
S.R.: I agree with this — we’re playing in quite an interesting minefield at the moment. It has lots of attractions but we are only really scratching the surface of what’s possible.
But I do think the ethics of what we’re doing at this level are different to, say, developing a machine that can make a phone call to someone.
‘This Shadowy Company Is Flying Spy Planes Over US Cities’ by BuzzFeed News
What tools out there you would recommend in order to run a machine learning project?
P.A.: I work in R. Also good libraries in Python, if that’s your religion. But the more difficult part was processing the data, thinking about how to process the data to give the algorithm more to work with. This was key for my planes project. I calculated variables including turning rates, area of bounding box around flights, and then worked with the distribution of these for each planes, broken into bins. So I actually had 8 ‘steer’ variables.
This ‘feature engineering’ is often the difference between something that works, and something that fails, according to real experts (I don’t claim to be one of those). More explanation of what I did can be found on Github.
There is simply no reliable national data on hate crimes in the US. So ProPublica created the Documenting Hate project.
S.R.: This is the big change in AI — the way it has become so much easier to use. So, Google hat on, we have some tools. And you can get journalist credits for them.
With Documenting Hate, we were concerned about having too much confidence in machine learning ie restricting what we were looking for to make sure it was correct.
ProPublica’s Scott Klein referred to it as an ‘over eager student’, selecting things that weren’t right. That’s why our focus is on locations and names. Even though we could potentially widen that out significantly
P.A.: I don’t think I would ever want to rely on machine learning for reporting. To my mind, its classifications need to be ground-truthed. I saw the random forest model used in the ‘Hidden Spy Planes’ story as a quick screen for interesting planes, which then required extensive reporting with public records and interviews.
What advice do you have for people who’d like to use machine learning in their upcoming data journalism projects?
P.A.: Make sure that it is the right tool for the job. Put time into the feature engineering, and consult with experts.
You may or may not need subject matter expert; at this point, I probably know more about spy planes than most people who will talk about them, so I didn’t need that. I meant an expert in processing data to give an algorithm more to work with.
Don’t do machine learning because it seems cool.
Use an algorithm that you understand, and that you can explain to your editors and audience.
Right tool for the job? Much of the time, it isn’t.
Don’t do this because it seems cool. Chase Davis was really good in the NICAR 2018 panel on when machine learning is the right tool:
Is our task repetitive and boring?
Could an intern do it?
If you actually asked an intern to do it, would you feel an overwhelming sense of guilt and shame?
If so, you might have a classification problem. And many hard problems in data journalism are classification problems in disguise.
We need to do algorithmic accountability reporting on ourselves! Propublica has been great on this:
But as we use the same techniques, we need to hold ourselves to account
S.R.: Yep — this is the thing that could become the biggest issue in working with machine learning.
What would you say is the biggest challenge when working on a machine learning project: the building of the algorithm, or the checking of the results to make sure it’s correct, the reporting around it or something else?
P.A.: Definitely not building the algorithm. But all of the other stuff, plus feature engineering.
S.R.: We made a list:
We wanted to be sure, so we cut stuff out.
We still need to manually delete things that don’t fit.
Critical when thinking about projects like this — the map is not the territory! Easy to conflate amount of coverage with amount of hate crimes. Be careful.
Always important to have stop words. Entity extractors are like overeager A students and grab things like ‘person: Man’ and ‘thing: Hate Crime’ which might be true but aren’t useful for readers.
Positive thing: it isn’t just examples of hate crimes it also pulls in news about groups that combat hate crimes and support vandalized mosques, etc.
It’s just a start: more potential around say, types of crimes.
I fear we may see media companies use it as a tool to cut costs by replacing reporters with computers that will do some, but not all, of what a good reporter can do, and to further enforce the filter bubbles in which consumers of news find themselves.
Hopes & wishes for the future of machine learning in news?
P.A.: I hope we’re going to see great examples of algorithmic accountability reporting, working out how big tech and government are using AI to influence us by reverse engineering what they’re doing.
Julia Angwin and Jeff Larson’s new startup will be one to watch on this:
I fear we may see media companies use it as a tool to cut costs by replacing reporters with computers that will do some, but not all, of what a good reporter can do, and to further enforce the filter bubbles in which consumers of news find themselves.
Here’s a provocative article on subject matter experts versus dumb algorithms:
Peter Aldhous tells us the story behind his project ‘Hidden Spy Planes’:
‘Back in 2016 we published a story documenting four months of flights by surveillance planes operated by FBI and Dept of Homeland Security.
I wondered what else was out there, looking down on us. And I realised that I could use aspects of flight patterns to train an algorithm on the known FBI and DHS planes to look for others. It found a lot of interesting stuff, a grab bag of which mentioned in this story.
But also, US Marshals hunting drug cartel kingpins in Mexico, and a military contractor flying an NSA-built cell phone tracker.’
Should all this data be made public?
Interestingly, the military were pretty responsive to us, and made no arguments that we should not publish. Certain parts of the Department of Justice were less pleased. But the information I used was all in the public, and could have been masked from flight the main flight tracking sites. (Actually DEA does this.)
US Marshals operations in Mexico are very controversial. We strongly feel that highlighting this was in the public interest.
About the random forest model used in BuzzFeed’s project:
Random forest is basically a consensus of decision tree statistical classifiers. The data journalism team was me, all of the software was free and open source. So it was just my time.
The machine learning part is trivial. Just a few lines of code.
If you had had a team to help with this, what kinds of people would you have included?
Get someone with experience to advise. I had excellent advice from an academic data scientist who preferred not to be acknowledged. I did all the analysis, but his insights into how to go about feature engineering were crucial.
Marianne Bouchart is the founder and director of HEI-DA, a nonprofit organisation promoting news innovation, the future of data journalism and open data. She runs data journalism programmes in various regions around the world as well as HEI-DA’s Sensor Journalism Toolkit project and manages the Data Journalism Awards competition.
Before launching HEI-DA, Marianne spent 10 years in London where she worked as a web producer, data journalism and graphics editor for Bloomberg News, amongst others. She created the Data Journalism Blog in 2011 and gives lectures at journalism schools, in the UK and in France.
The Winter Olympics 2018 in PyeongChang, South Korea, are just a few weeks away, and the football world cup 2018 is not far off either. While many journalists around the world are preparing their coverage, we wonder: how do you get ready for these big sporting events? What’s the difference between a sports data journalism project and any other data project? Where do you find data and analytics on this topic?
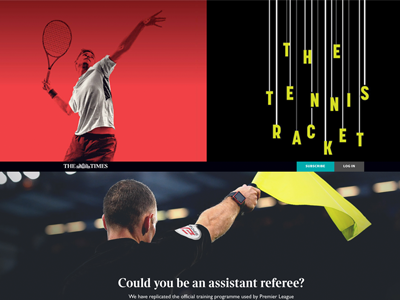
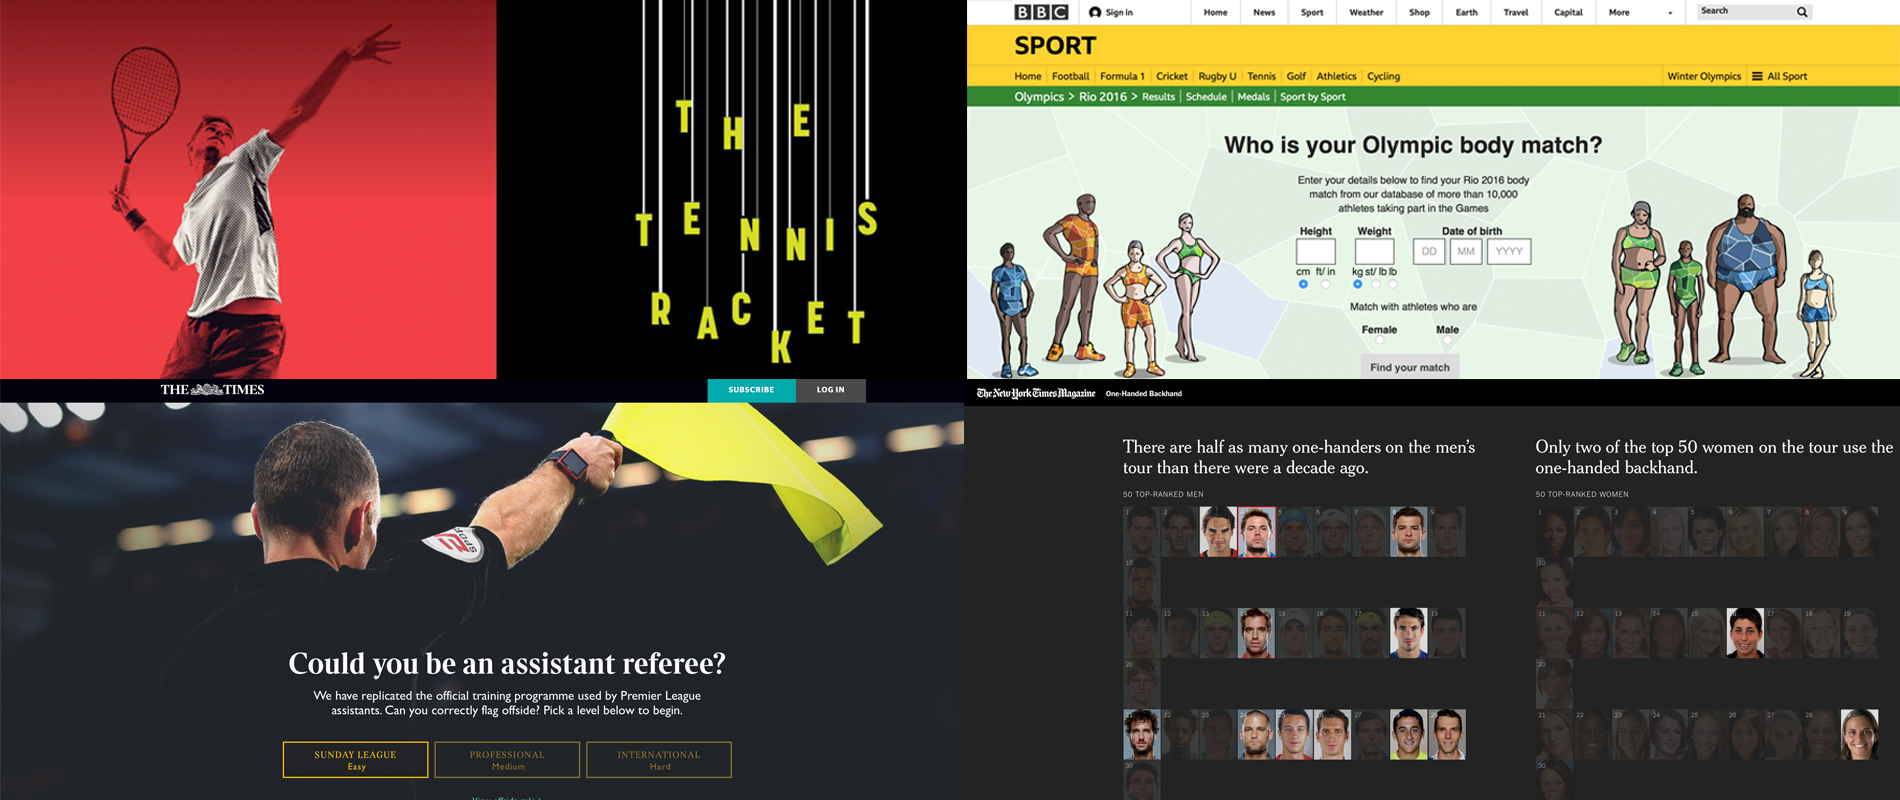
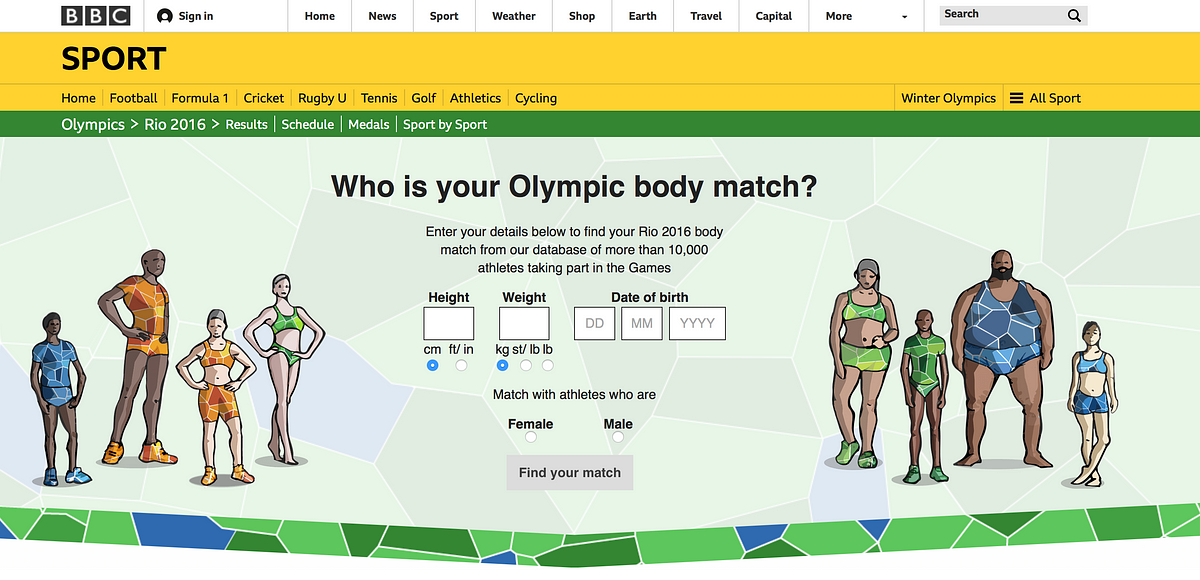
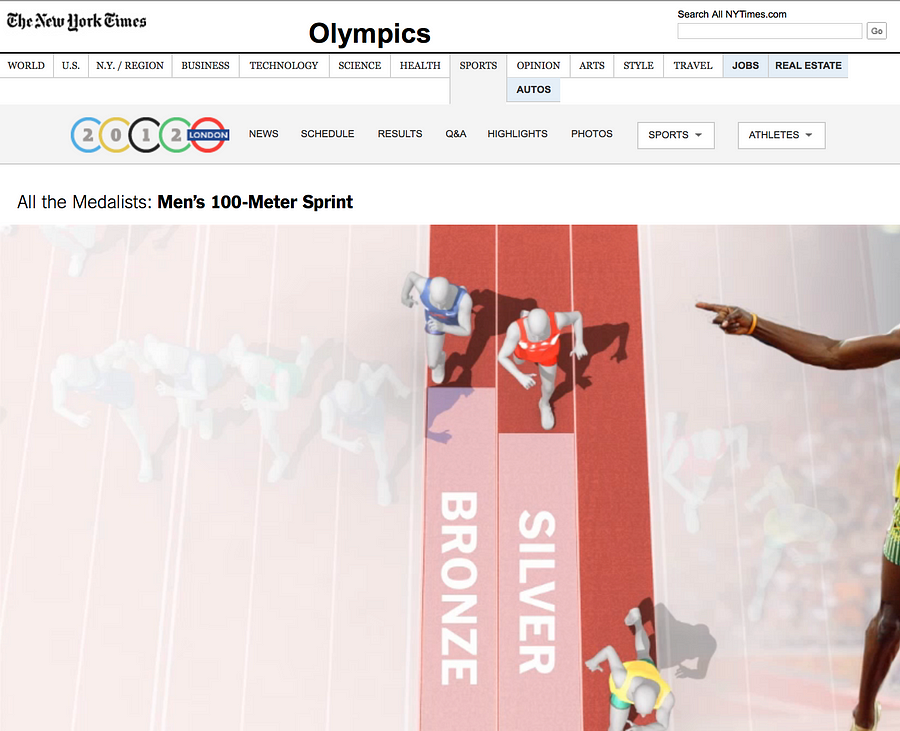
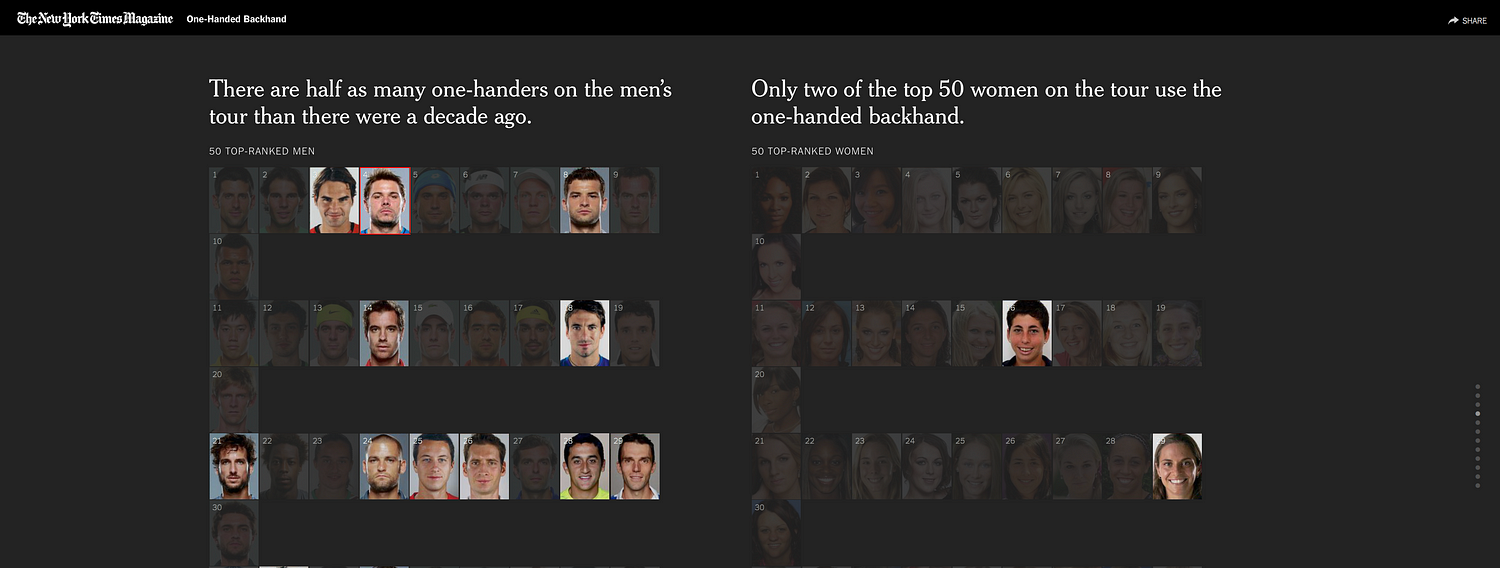
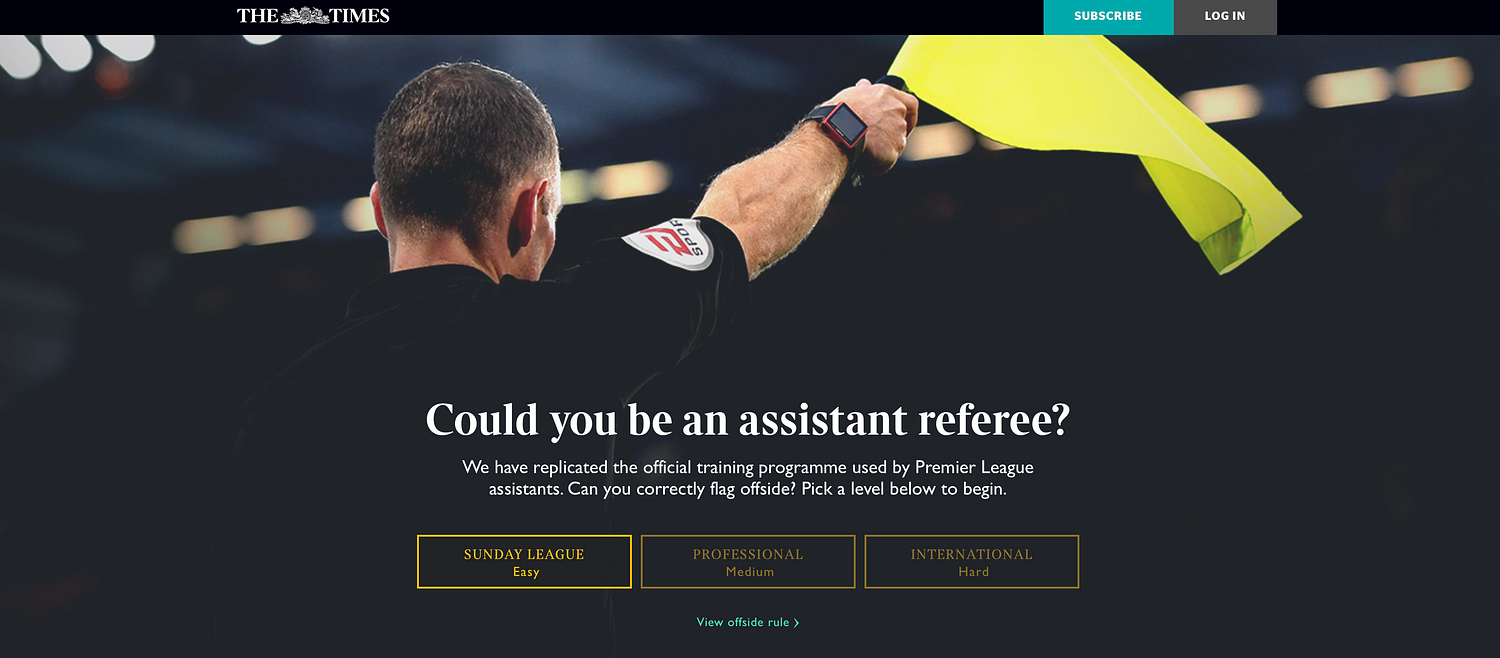
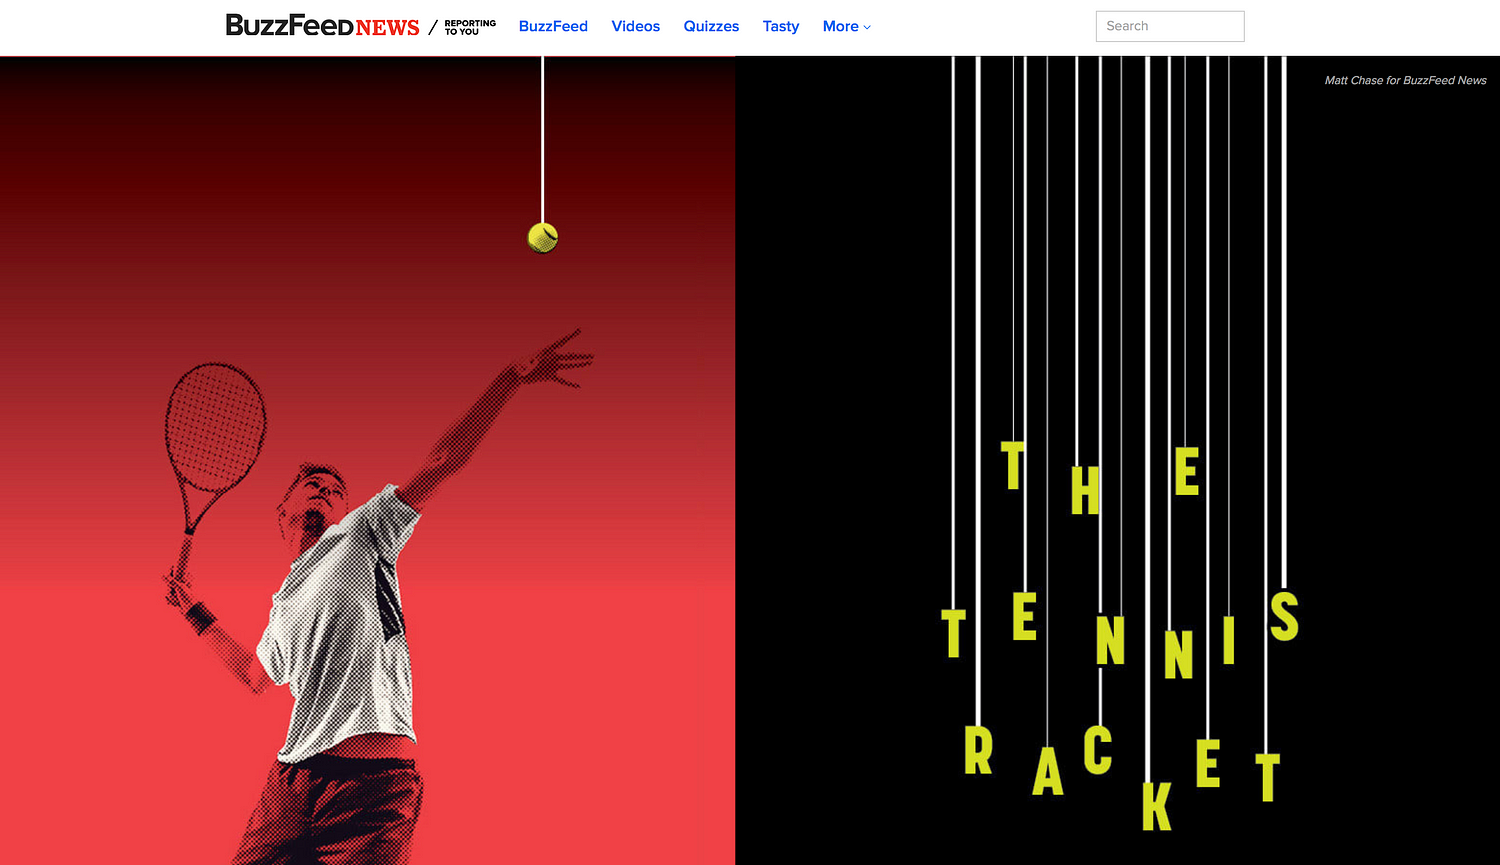
From top left, clockwise: ‘The Tennis Racket’ project by BuzzFeed News, ‘Who is your Olympic body match?’ by the BBC, the ‘One-handed backhand’ project by The New York Times, and ‘Could you be an assistant referee?’ by The Times.
We’ve gathered four experts from both sides of the pond to answer these questions and share tips on how to best work with sports data in the newsroom.
Steve Doig from ASU’s Cronkite School of Journalism (US), Paula Lavigne from ESPN (US), Nassos Stylianou from the BBC (UK), and Malcolm Coles, digital publishing strategy consultant, formerly with the Telegraph and the Trinity Mirror (UK), all joined the conversation. Here is a compilation of what we’ve learned.
The main differences between sports data and other types of data
All our experts agreed that working with sports data is a little different from working with any other types of data.
Here are the four main differences they pointed out during our discussion:
You don’t have to have a public records fight to get it
The problem with sports data is that there’s such a flood of it that people are still trying to find ways to get good signal out of all the noise
The data is often very granular (up-to-the-minute data, or even up-to-the-second data, is quite common)
Fans have a huge interest in it
“Sports is the one part of a news organisation where the consumers really care about numbers. It’s a lot harder to sell a data story in other news contexts,” Steve Doig (ASU’s Cronkite School of Journalism, US).
The fastest 100m times ever. Those caught doping struck out in red.
As the example above shows, there’s a whole data ecosystem of what you can call the ‘obsessed fans’, some of whom ‘have gone on to create viable business models of gathering and adding value to the raw data’, Doig argued.
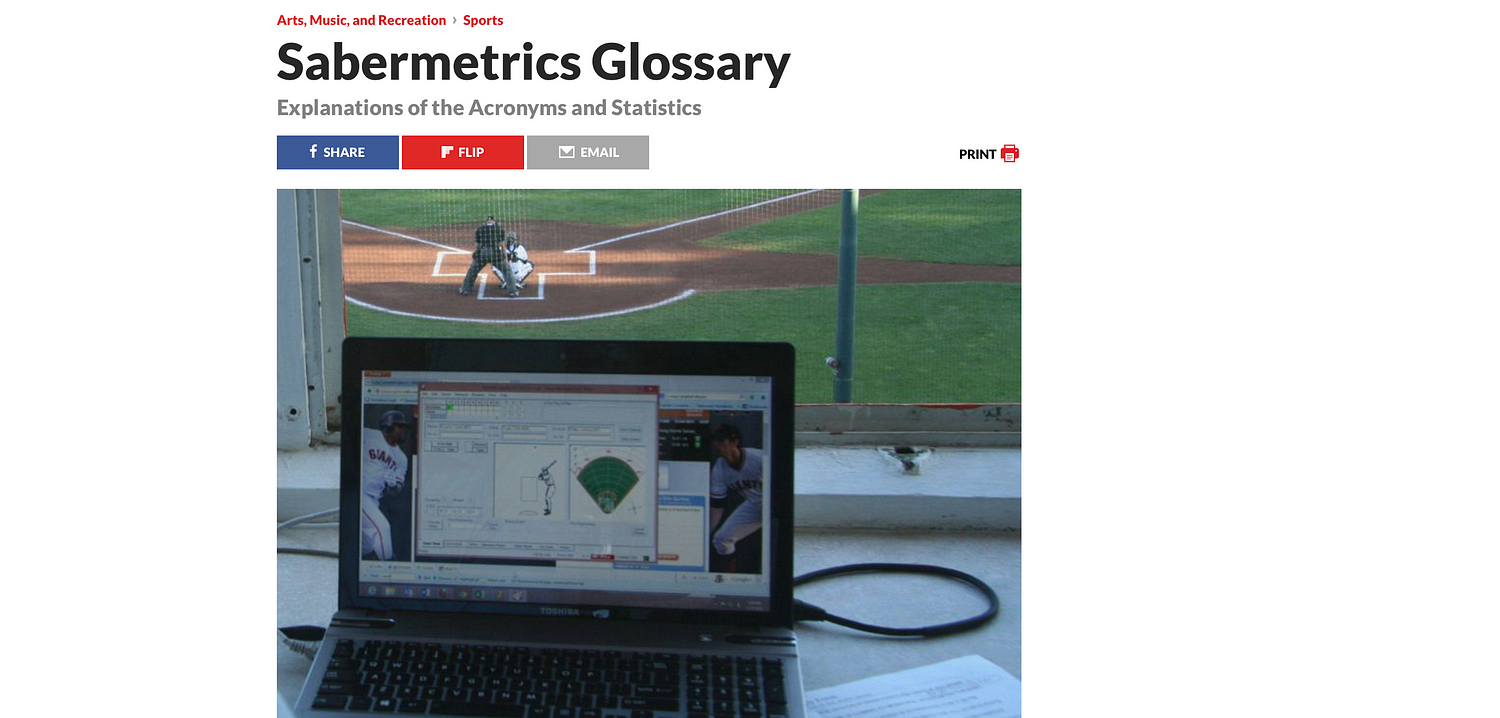
Steve Doig shared with us this glossary of some “moneyball” metrics that have been created, often by fans rather than the pros themselves
Where do you find sports data?
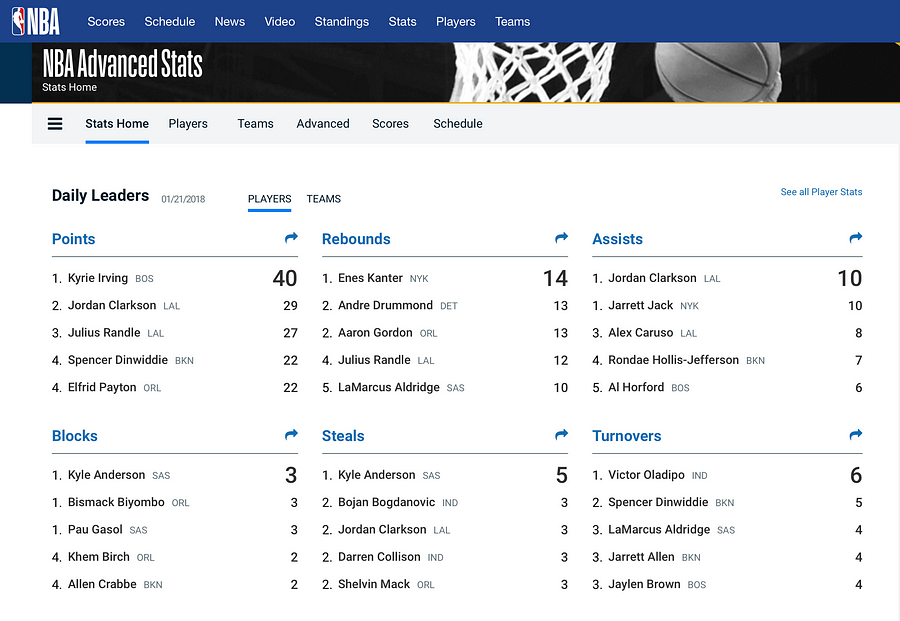
“In the US, certainly, the major pro sports leagues have opened up their data streams to just about anyone…and much of it can be played with using simple computer tools like Excel,” Steve Doig (ASU’s Cronkite School of Journalism, US).
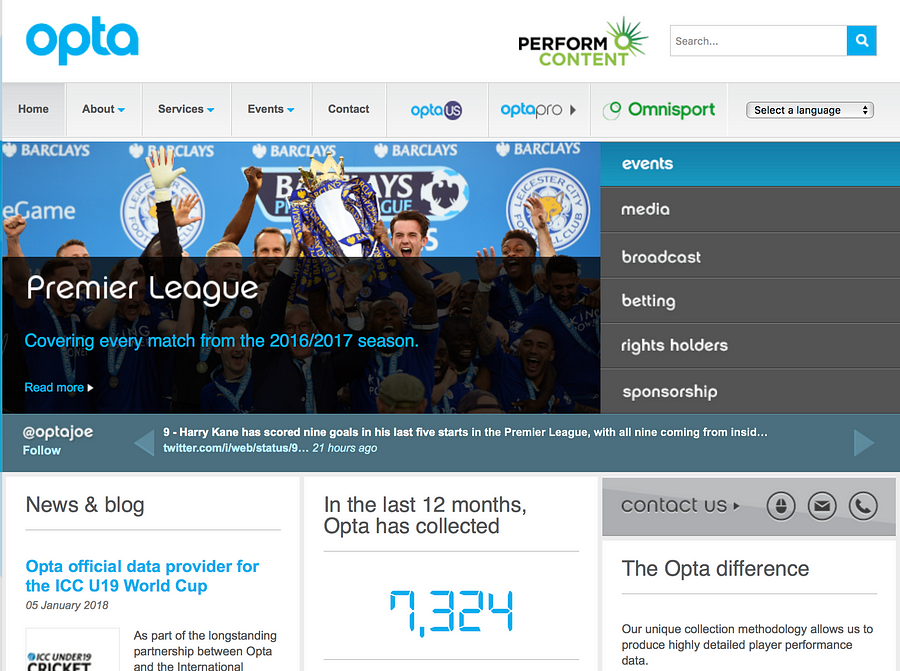
Opta is the world’s leading live, detailed sports data provider. A lot of their stats are proprietary, but a lot of news organisations in the world have agreements with them.
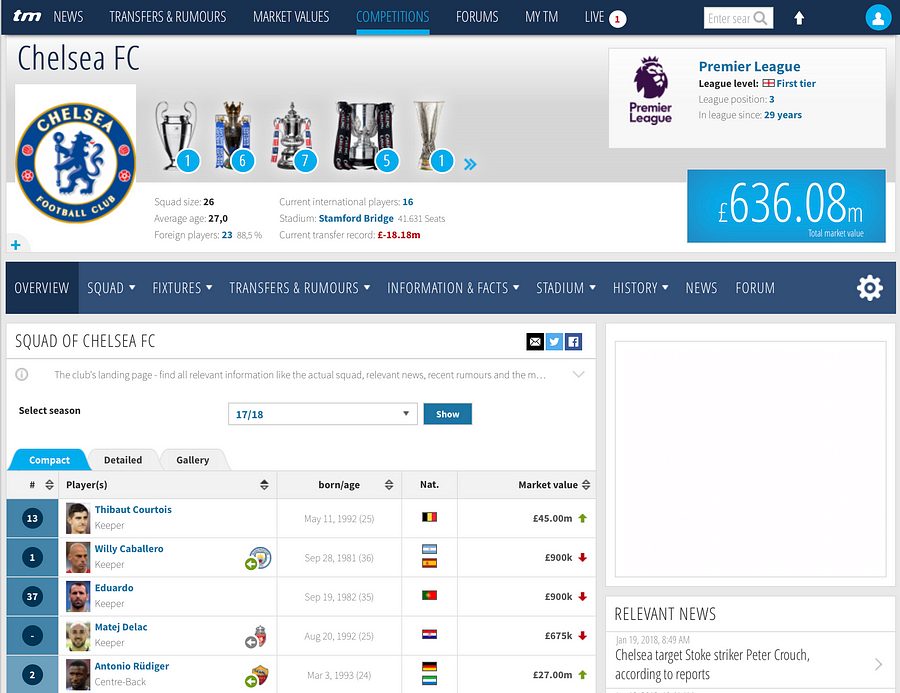
Transfermarkt is a German-based website owned by Axel Springer that has footballing information, such as scores, results, statistics, transfer news, and fixtures.
Many clubs are interested in incorporating statistics into their workflow, but few have the staff who know where to start. StatsBomb Services organises and parses all the data, delivers cutting edge visualisations and analysis, and is totally useful to journalists too.
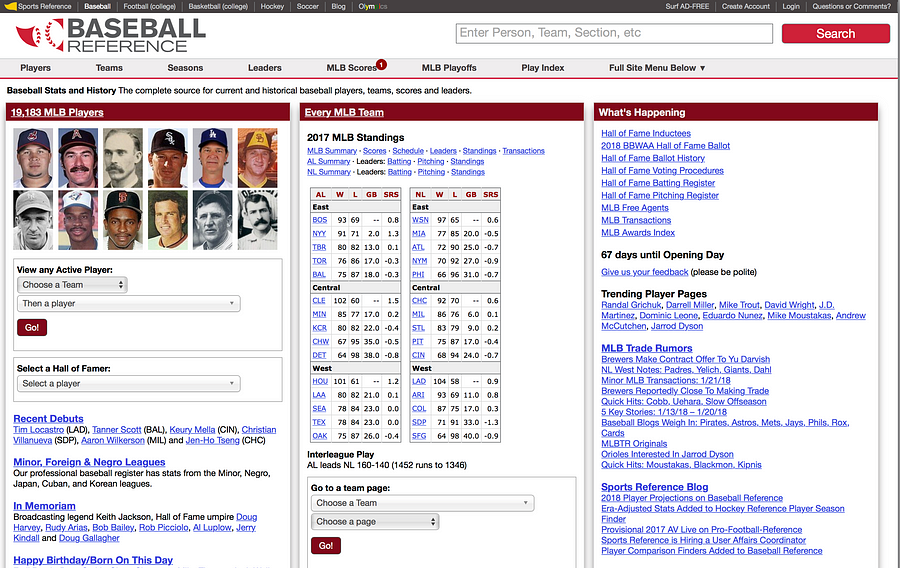
Sport-reference websites (US)
In the US, a good source of data are the various *-Reference.com sites, with the asterisk filled in with the name of the sport, like baseball and pro football (American style).
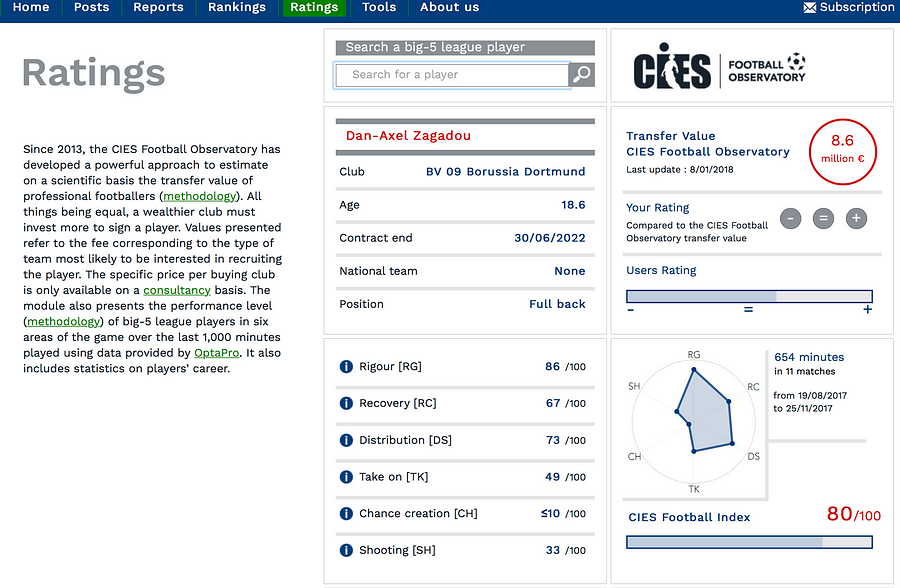
Since 2013, the CIES Football Observatory has developed a powerful approach to estimate the transfer value of professional footballers on a scientific basis.
For cricket data, ESPN cricinfo is fantastic. It gathers very granular information on all matches and series from the past few years, ordered by country or by team.
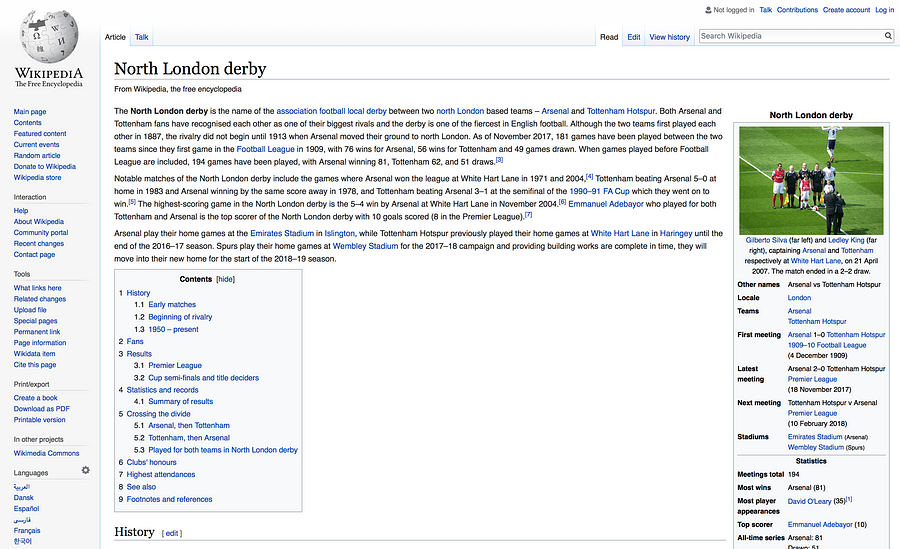
Scroll down Wikipedia pages and they often have tables of data that you can grab.
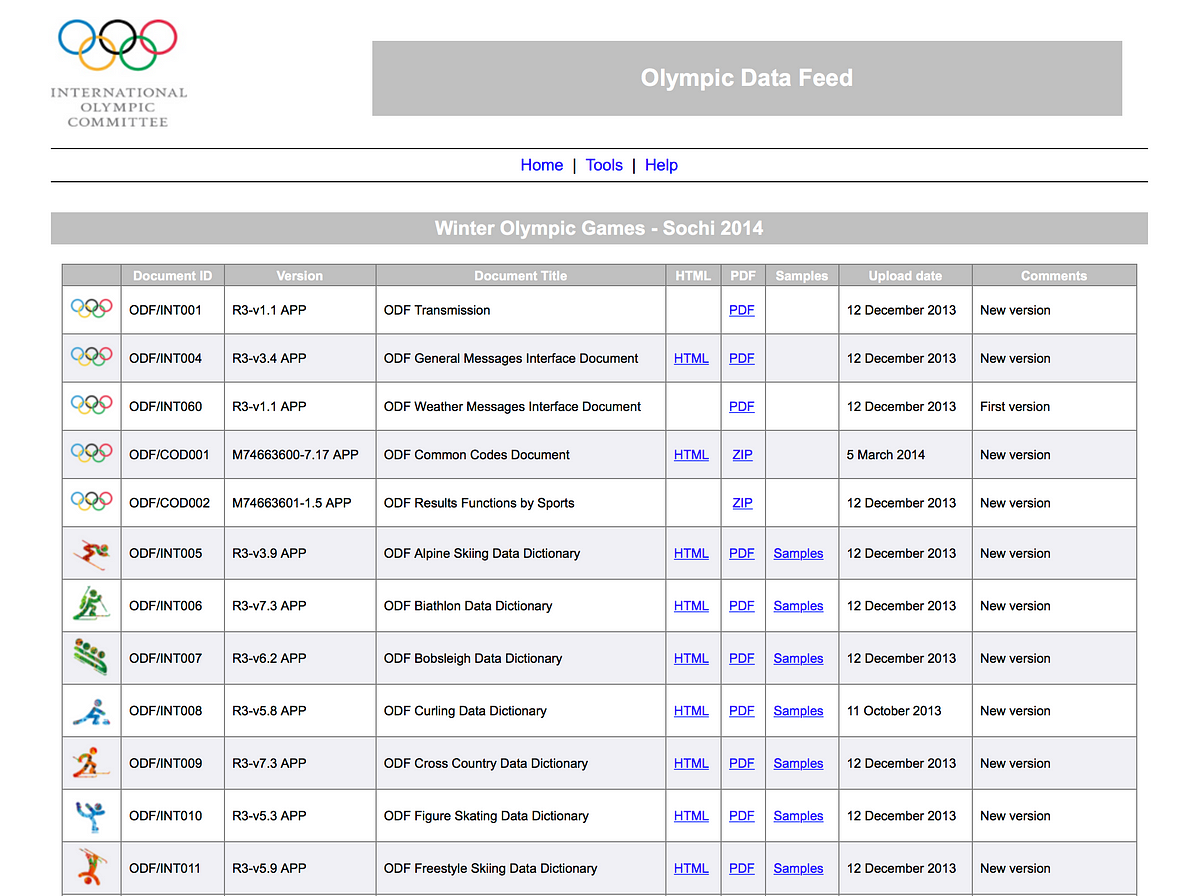
Where do you find olympics data?
When it comes to the Olympic Games it is usually the Olympics Data Feed that has all the data:
The Olympic Data Feed is used by many news organisations worldwide
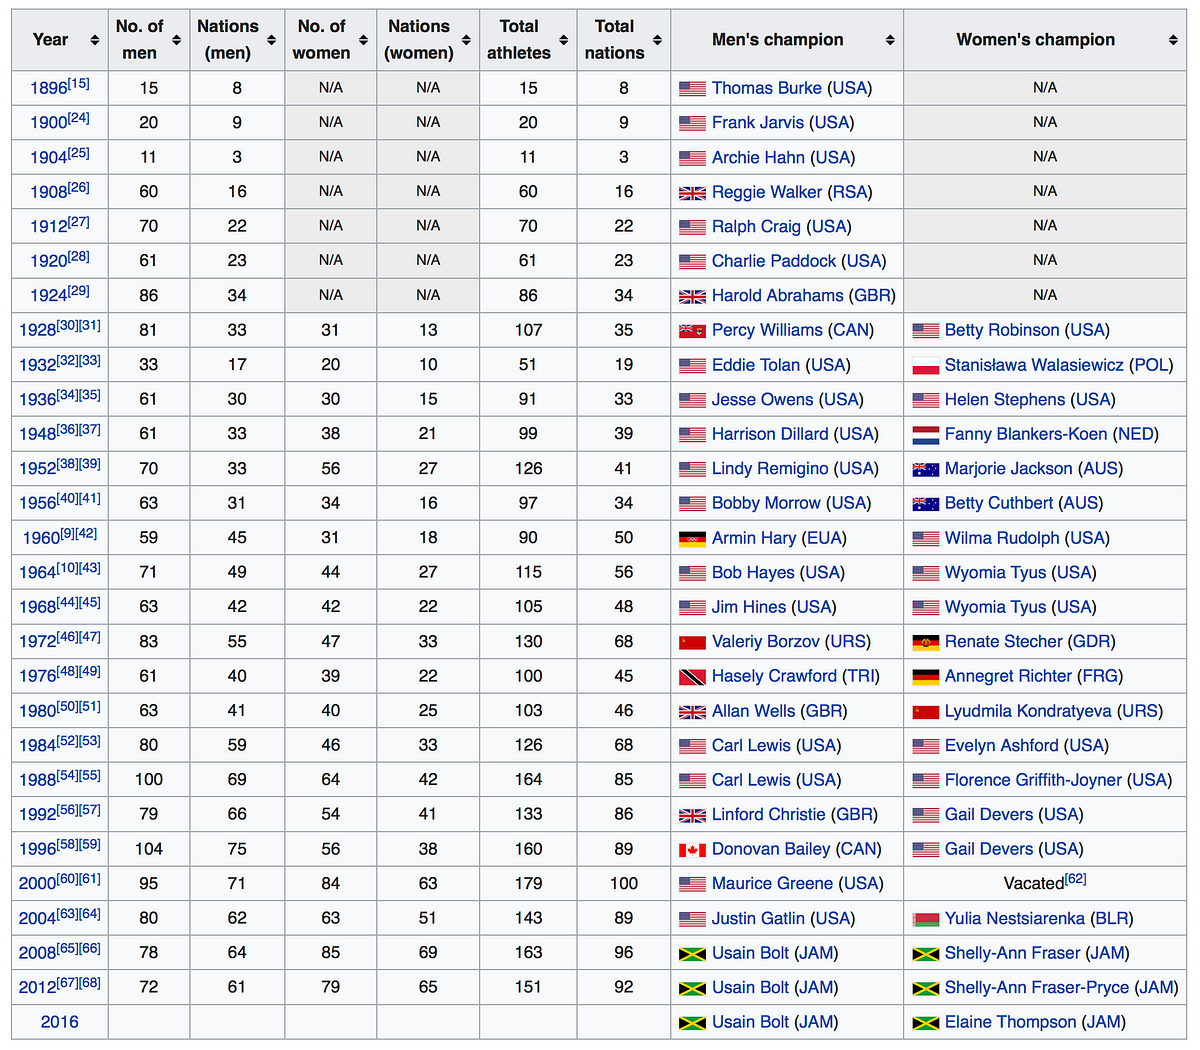
Alternatively, you can always look at Wikipedia, where a lot of data tables are available. For example, here is a table about the 100 metres at the Olympics:
Wikipedia offers a lot of historical data related to the olympics
“What is fantastic with Olympic Games is the very different attributes of the athletes (age, height, weight) which you do not really get with other sports,” Nassos Stylianou from the BBC (UK).
Here is a project the BBC ended up doing for the Rio Olympics:
Over 10,500 athletes out of some 11,500 in the official Olympic Data Feed (ODF) have been used in this project.
Is verification a big issue in sports data?
“Verification is tricky, but not in the same way as data verification for other topics. It could be tricky when different data organisations or websites have different methodologies in their data collection,” Nassos Stylianou from the BBC (UK).
How do you choose which data to go after?
Nassos Stylianou: From our point of view, presenting data in a way that the audience understands is key. So wherever possible really, ‘industry standards’ are great, if they are meaningful and can provide interesting stories. But sometimes, it is the analysis of that data in a slightly different way that could provide a new and interesting angle. I don’t think that is different to any other type of data journalism really. Ask the right questions of your data, ask why certain things could be happening, try to visualise them in a way that answers all these questions.
Malcolm Coles: It depends what you’re trying to achieve. Are you looking to illuminate a specific event or match? Or trying to tell a story? Even for the latter, I think something like the project ‘One race, every medalist ever’ by The New York Times is doable with just Wikipedia data. But if you wanted to tell the story of how Bolt dominates, you would need split times for every 10m and you can’t get that from Wikipedia.
Interesting examples to look at
This project below, which is video-led, is a good example of where analysis of techniques worked really well with some data.
The “One-handed backhand project” by The New York Times
And this one, is an example where the Times newspaper worked with the Football Association to build a game for their audience to show how difficult or easy it is to referee (The Wall Street Journal did a similar one with being a tennis line judge). So working with analysts really does help.
What makes a good sports data story?
Steve Doig: Much of my career has been in investigative work, so I lean towards stories that investigate problems. A good example is the ‘Tennis Racket’ investigation by Buzzfeed’s John Templon and Heidi Blake.
The Tennis Racket investigation by BuzzFeed News
I also like fun stories, which can be created out of novel use of data. I’ve always argued that data journalism in general adds evidence to stories that otherwise would be collections of anecdotes. So sports data can do the same, I think. The data at least adds weight to the arguments being made about strategies or player choices, etc.
Nassos Stylianou: I don’t think this is different from any news story really –although it can be a lot more fun! So as with data journalism in general, a [good sports data story is a] story that tells you something new in a visually engaging way.
Malcolm Coles: A good sports data story is the same as any other good story really. I’ve tended to be more interested in how you can use data to visualise a story that you would otherwise tell in lots of complicated words.
Tips on visualising sports data
Nassos Stylianou: Always think of who your audience is. Many sports fans could be used to a certain type of visualisation that makes sense to them but makes no sense to other people. If you are aiming your story in their direction, you can work with that in mind but if you want this to go beyond the sport obsessive, that’s not always the best strategy.
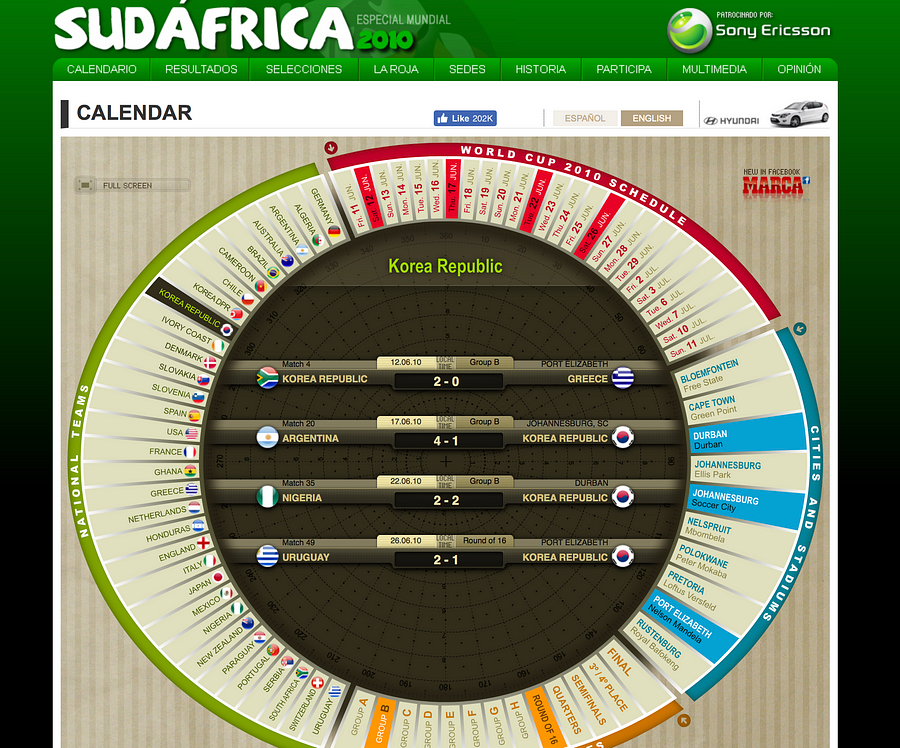
Malcolm Coles: I think a good visualisation is one that works on a mobile phone … I get shown this visualisation (pictured left) on the 2010 World Cup every year. It’s just fixtures data visualised — was great for its time. I get asked to build one like it every year, yet it won’t work on a mobile.
Steve Doig: Be aware of the growing number of sports analytics conferences being organized. The original, I believe, is the MIT Sloan Sports Analytics Conference held each year in Boston. About 1,800 young MBA students from all over the country (and now the world) show up trying to get hired as data analysts by sports leagues.
How do you get ready for big sports events like the Olympics, the Superbowl, or the Football World Cup?
Steve Doig: I’d say, do the same thing the on-air commentators do: gather all the relevant historical stats and be ready to use them in your stories. It’s also good to have stable of data analytics experts whose voices you can add to your stories.
Nassos Stylianou: Yep, prep well in advance. The great thing with these big events is also to build things that will work throughout the tournament.
Malcolm Coles: Try and build stuff outside of one off stories or investigations that you can reuse when the big tournament is over.
Over the past six years, the Global Editors Network has organised the Data Journalism Awards competition to celebrate and credit outstanding work in the field of data-driven journalism worldwide. To see the full list of winners, read about the categories, join the competition yourself, go to our website.


 RADAR is a collaboration between the Press Association and Urbs Media that delivers news stories to local media, combining the work of humans and machines.
 Michaela Gruber is a journalism and media management student, based in Vienna, Austria. During her studies she spent a semester abroad in France, where she started working for HEI-DA.