From Asia and beyond: experts discuss data journalism challenges

This article was originally published on the Data Journalism Awards Medium Publication managed by the Global Editors Network. You can find the original version right here.

___________________________________________________________________________________________________________________


How easy (or difficult) is it to access data in China, Malaysia, Kenya, and other countries? Are there tested business models for data journalism in different parts of the world? How do you promote data literacy in newsrooms where innovation is not a priority? We’ve gathered international experts to tackle those questions, and discuss government interference, the pace of learning, and managerial issues.


Darren Long, head of graphics at South China Morning Post (Hong Kong), Kuek Ser Kuang Keng from Data N and former Google fellow at PRI (Malaysia), Eva Constantaras, Google Scholar from Internews and expert in data journalism for Africa, Asia and South America (originally from Greece), and Yolanda Ma from Data Journalism China, also jury member of the Data Journalism Awards competition (China), all joined us, as well as participants from other countries.


From left to right: Darren Long, Yolanda Ma, Eva Constantaras and Kuek Ser Kuang Keng


How widespread would you say data journalism is in your region?


Kuek Ser Kuang Keng: People like to see Southeast Asia as a ‘region’ but the fact is countries in this region are very diverse in terms of development stage, politics, and technology. So there’s no way to generalise them.

In Malaysia, my own country, data journalism is almost non-existent; there are only infographics. There is a strong interest among a small group of journalists, but they lack support from editors and management, who focus more on social media. Innovation in journalism is not prioritised. In neighbouring countries, such as Indonesia and the Philippines, things might be a little better, but they are still relatively far behind the West. In non-democratic countries where free press is always under siege like Cambodia, Vietnam, Laos, and Thailand, the landscape is totally different. There, the survival of independent journalism is above all other things like innovation.

Darren Long: It’s a good point. I was going to say Europe and America can feed off each other through the use of English language and a common Roman script whereas Asia is much more diverse. Press freedom is certainly an issue. Even in Hong Kong where we have a feisty and largely free press.

Visual journalism and the use of data is a good way to avoid government interference though. If you can use data to make your point from government sources, there is little they can criticise. The problem is getting public and government data. It is very hard to get consistent and reliable sources from Mainland China.


Yolanda Ma: In mainland China, since data journalism was introduced five years ago, it has been widely accepted and adopted by media organisations, from official newspapers to commercialised online portals. The development is limited due to the cost (both technical and human resources). It is more recognised by the industry than by the public.

Eva Constantaras: My specialty is introducing data journalism in countries where it basically doesn’t exist. General trends I see are: publishers get excited because it sounds digital and visual and sexy, mid-level editors and senior reporters are in denial about digital convergence and are afraid of it so don’t want to know anything about it, and early career journalists are excited about it for three reasons: 1. They want to still have a job once digital convergence happens 2. They think data visualisation looks fun and 3. (least common) they see how data can enrich their public interest reporting by making their stories more analytical.


How accessible is public data in your country? What advice do you have on how to access data (public or else)?


Darren Long: We have freedom of information but it’s a fine line.

Here are some useful websites: Open Data Hong Kong, Data.gov.hk and N3Con 2018.

Kuek Ser Kuang Keng: There’s no FOI in Malaysia, Singapore and other non-democractic Southeast Asian countries but it exists in Indonesia and the Philippines. While sensitive information is not available, Malaysia and Singapore governments do publish a lot of data online. Both countries have a dedicated open data portal and relevant policies.

However media in both countries don’t have a strong demand for government data nor the skill, knowledge, and habit to use data in their reporting. The main demand comes from the business/IT community which is adopting business analytics very fast. So before talking about accessing any data, there need to be awareness, skill, and knowledge within newsrooms on data journalism. It seems like this awareness is higher in Indonesia and the Philippines. There’s a specialised business data news startup in Indonesia called Katadata, that you may want to check out:


Eva Constantaras: The first excuse I get from journalists for not doing data journalism is that there isn’t enough data. In all the countries I have been in, I would not say that is among even the top 3 challenges. And partially that’s because nobody has ever used the little data there is, so they need to build up demand in order for more data to be released. The biggest challenge is finding journalists who are willing to abandon their jobs as stenographers and embrace their role as knowledge producers. This is not a problem data or technology can solve.

Darren Long: I agree with that. I find a lot of the problem is more about thinking how to visualise data in a creative manner than the non-existence of data.

Yolanda Ma: People usually have the impression that China doesn’t have much data but the reality is quite the opposite. There is tons of data, just not well published and usually unstructured. Sometimes the data is inaccurate and not reliable. There is a FOI regulation and media do use it for stories, but less for data.

But things are getting better, compared with five years ago. In China more data is released (effort has been made to convince government and also help them to get it right), the open data movement is still on and pushing for better data culture, especially collaboration between universities, companies, government, but also NGOs and citizens.


What are the main challenges data journalists face in your region?


Eva Constantaras: I think journalists underestimate the work that goes into a data story. It’s not enough to just use data to reveal the problem because of the ubiquity of corruption in so many countries. For a story to have an impact and get people’s attention, it has to measure the problem, the causes, the impact on citizens and potential solutions. That’s more work than journalists are used to. Many journalists just want to make visualisations. I tell them visualisations are the paint on the house. Their house can be a beautiful colour but if their analysis is bad, their structure is unsound, their pretty house will fall down.

Darren Long: Technology has been an issue for us. We have to create our infographics outside the company CMS and redirect the page. If we weren’t so stubborn we would have given up long ago

Kuek Ser Kuang Keng: Newsroom managers don’t have much awareness of data journalism and the digital disruption has put news companies in a tough position financially. The limited resources that news companies can allocate have been put into ‘hot’ fields like social media and video. A good number of journalists are eager to learn new skills but they don’t get much support to pick up new skills and put those skills into use. I wish technology was an issue in Malaysia. We don’t even have data or interactive team in newsrooms here. I’m the only data journalist in Malaysia.

Yolanda Ma: Talent is an issue everywhere, but the challenge beyond that is the cost — the cost to develop the skills and to maintain such a team in the newsroom. Many data stories in China are now going video or motion graphics as well to stay aligned with consumer trends.

Here is an example of data journalism on TV:


Parcels from Faraway Places (subtitles in English)


How do you overcome these challenges? What creative solutions could we find for them?


Kuek Ser Kuang Keng: How to overcome? I find the main hurdle lies with managers and editors, so I would approach them to provide them a better understanding of data journalism — the potential, impacts and costs, or talent needed. Another good way is to build networks among journalists who share the same interests, so they can support each other, and exchange ideas on how to convince their bosses.

Money is a huge problem in Malaysia. The digital disruption has put news companies in a tough position financially. They want something that can see quick returns, often financially

Eva Constantaras: I think we have to abandon the myth that learning data journalism is ‘fast’, something that can be picked up at a bootcamp. Someone should do a data study of how many data journalists come out of bootcamps. And how many statistically unsound stories came out by the few who did manage to produce a data story.

We want data journalism to be taken seriously so we need a serious approach to capacity building. I have a 200-hour training and production model bringing together journalists, civic hackers, and CSOs with data that has worked in a couple of countries but usually because we found committed journalists who were willing to be the lone data journalist in their newsroom. And we do a lot of outreach and convincing of editors and publishers.


Are there any tested business models (other than grants) for data journalism in developing countries?


Question from Stephen Edward (Astat Consulting, India)

Kuek Ser Kuang Keng: Unfortunately, not that I know of, but you can keep a watch on Katadata, a specialised data business news startup in Indonesia. They will increase their monetisation efforts soon.

Eva Constantaras: The only media outlet in a developing country that really sees a lot of revenuee coming from their data work is Nation Newsplex in Kenya, and part of that is because the Nation Media Group can repurpose the online data content for two different print publications and their television station. It’s still a very small team.


Donor support is also often not well structured. They want to give data reporting grants in countries without data reporters. Or they want to give funding for one-off projects that then die a slow death. It’s expensive to train and sustain a data team and most donors don’t make that investment.

Yolanda Ma: One business model that a newsroom is trying (not proved yet) is the think tank approach — they really specialised in urban data, so by digging into data and finding trends, they can actually provide the product for policy makers, urban design industry, etc.

When one data team do very well within the news organisations — another way to go is to spin off. Caixin’s former data head set up his own company last year and it provides service to other media organisations on data stories production now.

The good thing about spinning off is that you do not need to only do journalism projects — which are usually not that profitable. But by being independent you can do commercial projects as well.

Eva Constantaras: The nice thing about spinning off is also then data content can be distributed through a variety of popular media and reach a larger audience.


What can we do to get more high quality data journalism projects from the Global South? And, given that it is harder for the Global South to compete with the Global North, is there a way to build more recognition for the south?


Question from Ben Colmery (ICFJ Knigt Felllowships director, USA)

Yolanda Ma: There are some quite high quality data journalism projects in the South and they don’t have to compete with the North.

Kuek Ser Kuang Keng: As I mentioned earlier, there are far less reporting about the innovations including data journalism projects done by news organisation in Asia. We don’t have Nieman Lab or Poynter here (fortunately we still have djchina.org but it is in Chinese). There are good projects, often done in tough environment, but they don’t get much attention outside of their own country. I can see more and more projects from Latin America were featured in journalism portals but that kind of treatment has not reached Asia. However, language remains a challenge.

Eva Constantaras: I am not sure why they would need to compete since they have different audiences. Though one revenue model I am very interested in is encouraging Western media outlets to buy content from data journalists in the Global South instead of parachutting in their own expensive journalists who do superficial stories.

I think now the West has realized that it needs to do more data-driven reporting on the local level for rural and less educated audiences about issues they care about. I think that the value of data journalism in developing countries is exposing the roots of inequality and helping citizens make better decisions and push for a more accountable government on a local level. Those projects don’t have to be flashy. They just have to be effective and accurate.

Darren Long: I think what international news outlets do well is broad comparative visualisations based around strong concepts. I think we tend to over rely on charts and graphics in Asia.

What is interesting right now is how a market like China has incredibly deep reach through mobile phones. Massive markets do everything on their phone. The tier one cities are easily as sophisticated as the West in that area.

So if we can leverage consumption of dataviz on mobile there should be a massive appetite


Can you share one tip you wish you’d been given about data journalism in the region you work in?


Yolanda Ma: I’d say, in Asia, do start looking for opportunities for cross-border data stories.

Eva Constantaras: Identify questions that citizens need answered to improve their quality of life and build your data stories around answering those questions.

Kuek Ser Kuang Keng: Data journalism takes time and patience. Visualisation is usually the quickest and easiest part!

Yolanda Ma: To echo Eva’s point — yes, don’t just produce meaningless fancy visuals.


Examples of data journalism from around the world that you should go and check out:


Darren Long: The Singapore Reuters office is producing some stunning multimedia data visualisations.

Here’s one they did on the oil spill off China:


But they have international resources and can recruit from all over the world

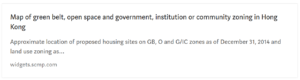
Here’s an example of a story we did at South China Morning Post. The data was from the government, but they didn’t like the story. If you click on our source, the page opens with a great big disclaimer they added after we didnt take our page down:


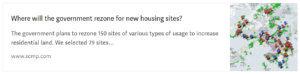
The map itself is still up:


A few more that I like:


Kuek Ser Kuang Keng: Tempo is a highly respectable magazine in Indonesia that produces great investigative reports. But most of their data journalism projects are on print. Here’s a deck shared by their editor-in-chief that showcase some of their data stories.


Malaysiakini is also working hard in data journalism. I recently collaborated with them to produce the first newsgame in Malaysia. It explains the issue of malapportionment in Malaysian election system.


Yolanda Ma: Here is a deck I made on data journalism in China a year ago — it serves as a good overview for anyone who’s interested:


Other organisations from China you should check out: Caixin, the Paper/SixthTone, Yicai, DT.

I like IndiaSpend in India and Katadata in Indonesia too.

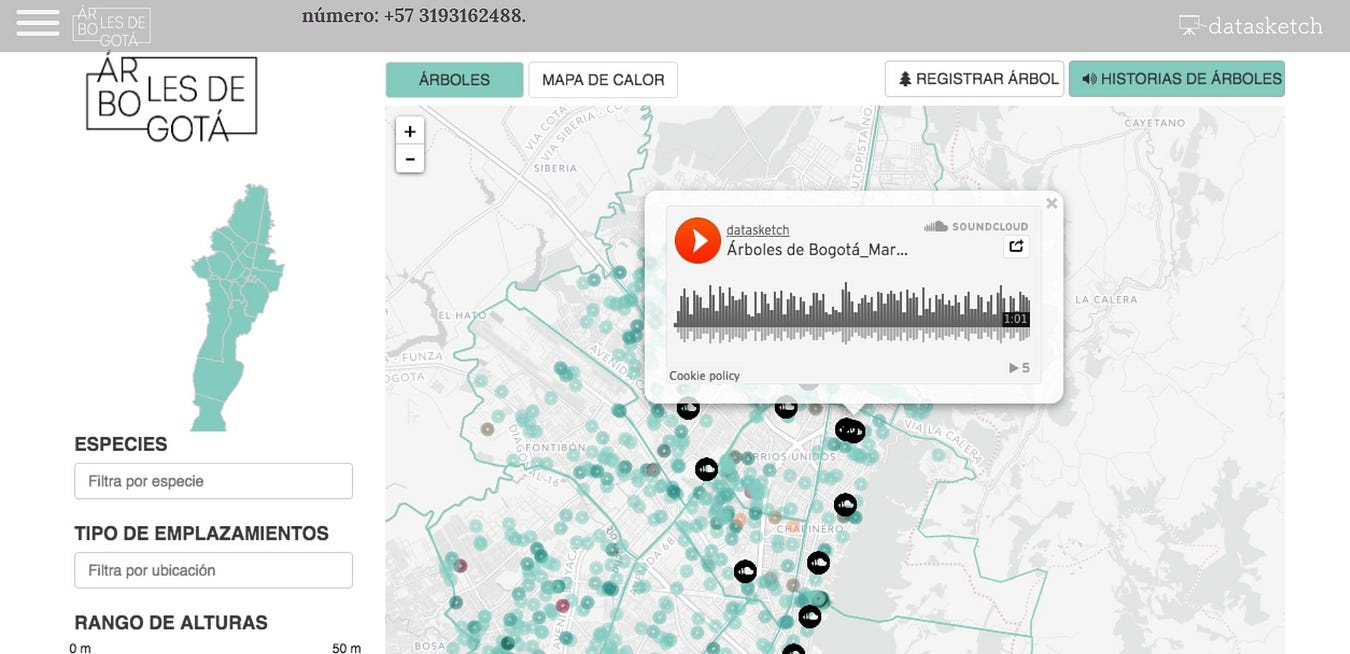
Eva Constantaras: Here’s an example of a story that might have been risky without government data:


Some of my favourites are IndiaSpend and Hindustan Times in India, Daily Nation Newsplex in Kenya, Ojo Publico in Peru and both La Nacion Argentia and Costa Rica.

Kuek Ser Kuang Keng: I agree with Yolanda and Eva, at the reporter level, a good number of journalists are eager to learn a new skill but they don’t get much support from editors or managers to pick up new skills and put those skills into use.

I would recommend Rappler in the Philippines, Katadata and Tempo in Indonesia. But only Katadata has a dedicated vertical for data stories


To see the full discussion, check out previous ones and take part in future ones, join the Data Journalism Awards community on Slack!

Over the past six years, the Global Editors Network has organised the Data Journalism Awards competition to celebrate and credit outstanding work in the field of data-driven journalism worldwide. To see the full list of winners, read about the categories, join the competition yourself, go to our website.


marianne-bouchart

Marianne Bouchart is the founder and director of HEI-DA, a nonprofit organisation promoting news innovation, the future of data journalism and open data. She runs data journalism programmes in various regions around the world as well as HEI-DA’s Sensor Journalism Toolkit project and manages the Data Journalism Awards competition.

Before launching HEI-DA, Marianne spent 10 years in London where she worked as a web producer, data journalism and graphics editor for Bloomberg News, amongst others. She created the Data Journalism Blog in 2011 and gives lectures at journalism schools, in the UK and in France.

A data journalist’s microguide to environmental data

This article was originally published on the Data Journalism Awards Medium Publication managed by the Global Editors Network. You can find the original version right here.

_______________________________________________________________________________________________________________________


Lessons learned from an online discussion with experts

The COP23 conference is right round the corner (do I hear “climate change”?) and many data journalists around the world may wonder: How do you go about reporting on environmental data?


With the recent onslaught of hurricanes, such as Harvey, Irma, and Maria, and wildfires in Spain, Portugal and California, data journalists have been working hard to interpret scientific data, as well as getting creative to make it reader friendly.

The COP23 (do I hear climate change?) also serves as a great opportunity for data journalists to take a step back and ask:

What is the best way of reporting on data related to the environment? Where do you find the data in the first place? How do you make it relatable to the public and which challenges do you face along the way?

From top left to bottom right: Kate Marvel of NASA GISS (USA), James Anderson of Global Forest Watch (USA), Rina Tsubaki of European Forest Institute (Spain), Gustavo Faleiros of InfoAmazonia (Brazil), Elisabetta Tola of Formicablu (Italy), and Tim Meko of The Washington Post (USA)


We gathered seven amazing experts on the Data Journalism Awards Slack team on 5 October 2017 to tackle these questions. Tim Meko of The Washington Post (USA), Gustavo Faleiros of InfoAmazonia (Brazil), Rina Tsubaki of European Forest Institute (Spain), Kate Marvel of NASA GISS (USA), Elisabetta Tola of Formicablu (Italy), Octavia Payne and James Anderson of Global Forest Watch (USA), all took part in the discussion.

Here is a recap of what we’ve learned including tips and useful links.


Environmental data comes in many formats…only known by scientists


When it comes to working with environmental data, both journalists and scientists seem to be facing challenges. The main issue seems not to come from scarcity of data but rather from what journalists can do with it, as Elisabetta Tola of Formicablu (Italy) explained:

‘Things are still quite complicated because we have more data available than before but it is often difficult to interpret and to use with journalistic tools’, she said.

There also seems to be a gap between the speed at which data formats evolve in that area and how fast journalists learn how to work with these formats.

‘I think we are still in a moment where we know just a little about data formats. We know about spreadsheets and geodata, but then there are all these other formats, used only by scientists. And I am not really sure how we could use those’, said Gustavo Faleiros of InfoAmazonia (Brazil).

Environmental data should be more accessible and easy to interpret and scientists and journalists should be encouraged to work hand-in-hand more often. The existing incentive structure makes that hard: ‘Scientists don’t get paid or promoted for talking to journalists, let alone helping process data’, said Kate Marvel of NASA GISS (USA).


So what could be done to make things better?


“We need to open up more channels between journalists and scientists: find more effective ways of communicating’, said Elisabetta Tola of Formicablu.

We also need more collaboration not just among data journalism folks, but with larger communities.

‘Really, it is a question of rebuilding trust in media and journalism’, said Rina Tsubaki of European Forest Institute.

‘I think personalising stories, making them hyper-local and relevant, and keeping the whole process very transparent and open are key’, said James Anderson of Global Forest Watch.

Indeed, there seems to be a need to go further than just showing the data: ‘People feel powerless when presented with giant complex environmental or health problems. It would be great if reporting could go one step further and start to indicate ‘what’s the call to action’. That may involve protecting themselves, engaging government, responding to businesses’, said James Anderson of Global Forest Watch.

Top idea raised during the discussion: “It would be great to have something like Hacks&Hackers where scientists and journalists could work together. Building trust between these communities would improve the quality of environmental reporting but also the reward, at least in terms of public recognition, of scientists work.” Suggested by Elisabetta Tola of Formicablu.


To make environmental data more ‘relatable’, add a human angle to your story


As the use of environmental data has become much more mainstream, at least in American media markets, audiences can interact more directly with the data than ever before.

‘But we will have to find ways to keep innovating, to keep people’s attention, possibly with much more personalised data stories (what does the data say about your city, your life in particular, for example)’, said James Anderson of Global Forest Watch.

‘Characters! People respond to narratives, not data. Even abstract climate change concepts can be made engaging if they’re embedded in a story’, said Kate Marvel of NASA GISS.

For example, this project by Datasketch, shows how Bogotá has changed radically in the last 30 years. ‘One of the main transformations’, the website says ‘is in the forestation of the city as many of the trees with which the citizens grew have disappeared’.

This project by Datasketch, shows how Bogotá has changed radically in the last 30 years and include citizen’s stories of trees


With this project, Juan Pablo Marín and his team attached citizen stories to specific trees in their city. They mapped 1.2 million trees and enabled users to explore narrated stories by other citizens on a web app.

‘I like any citizen science efforts, because that gets a community of passionate people involved in actually collecting the data. They have a stake in it’, James Anderson of Global Forest Watch argued.

He pointed out to this citizen science project where scientists are tracking forest pests through people’s social media posts.

One more idea for engaging storytelling on climate change: Using art to create a beautiful and visual interactive:
Illustrated Graphs: Using Art to Enliven Scientific Data by Science Friday
Shared by Rina Tsubaki of European Forest Institute


Tips on how to deal with climate change sceptics


‘Climate denial isn’t about science — we can’t just assume that more information will change minds’, said Kate Marvel of NASA GISS.

Most experts seem to agree. ‘It often is more of a tribal or cultural reaction, so more information might not stick. I personally think using language other than ‘climate change’, but keeping the message (and call to action to regulate emissions) can work’, said James Anderson of Global Forest Watch.

A great article about that, by Hiroko Tabuchi, and published by The New York Times earlier this year can be found here: In America’s Heartland, Discussing Climate Change Without Saying ‘Climate Change’

‘Keeping a high quality and a very transparent process can help people who look for information with an open mind or at least a critical attitude’, Elisabetta Tola of Formicablu added.

A great initiative where scientists are verifying media’s accuracy:
Climate Feedback
Shared by Rina Tsubaki of European Forest Institute


Places to find data on the environment

The Planet OS Datahub makes it easy to build data-driven applications and analyses by providing consistent, programmatic access to high-quality datasets from the world’s leading providers.

AQICN looks at air pollution in the world with a real-time air quality index.

Aqueduct by the World Resources Institute, for mapping water risk and floods around the world.

The Earth Observing System Data and Information System (EOSDIS) by NASA provides data from various sources — satellites, aircraft, field measurements, and various other programs.

FAOSTAT provides free access to food and agriculture data for over 245 countries and territories and covers all FAO regional groupings from 1961 to the most recent year available.

Global Forest Watch offers the latest data, technology and tools that empower people everywhere to better protect forests.

The Global Land Cover Facility (GLCF) provides earth science data and products to help everyone to better understand global environmental systems. In particular, the GLCF develops and distributes remotely sensed satellite data and products that explain land cover from the local to global scales.

Google Earth Engine’s timelapse tool is useful for satellite imagery, enables you to map changes over time.

Planet Labs is also great for local imagery and monitoring. Their website feature practical examples of where their maps and satellite images were used by news organisations.


News from our community: In a few months, James Anderson and the team at Global Forest Watch will launch an initiative called Resource Watch which will work as an aggregator and tackle a broader set of environmental issues.

“It was inspired by the idea that environmental issues intersect — for example forests affect water supply, and fires affect air quality. We wanted people to be able to see how interconnected these things are,” said Anderson.


What to do if there is no reliable data: the case of non-transparent government


It is not always easy or straightforward to get data on the environment, and the example of Nigeria was brought about during our discussion by a member of the DJA Slack team.

‘This is because of hypocrisy in governance’, a member argued.

‘I wish to say that press freedom is guaranteed in Nigeria on paper but not in reality.

You find that those in charge of information or data management are the first line of gatekeepers that will make it practically impossible for journalists to access such data.

I can tell you that, in Nigeria, there is no accurate data on forestry, population figure and so on’.

So what is the way out? Here are some tips from our experts:

‘I would try using some external, no official sources. You can try satellite imagery by NASA or Planet Labs or even Google, then distribute via Google Earth or their Google News Lab. Also you can download deforestation, forest fires and other datasets from sites of University of Maryland or the CGIAR Terra-i initiative’, Gustavo Faleiros of InfoAmazonia suggested.

Here is an example:

Nigeria DMSP Visible Data By NOAA/NGDC Earth Observation Group

‘I think with non-transparent governments, it is sometimes useful to play both an “inside game” (work with the government to slowly [publish] more and more data under their own banner) and an “outside game” (start providing competing data that is better, and it will raise the bar for what people [should] expect)’, said James Anderson of Global Forest Watch.

‘It’s a really tough question. We’ve worked with six countries in the Congo Basin to have them improve their data collection, quality-control, and sharing. They now have key land data in a publicly-available portal. But it took two decades of hard work to build that partnership’, he added.

‘I think this is exactly the case when a good connection with local scientists can help’, said Elisabetta Tola of Formicablu. ‘There are often passionate scientists who really wish to see their data out. Especially if they feel it could be of use to the community. I started working on data about seismic safety over five years ago. I am still struggling to get the data that is hidden in tons of drawers and offices. I know it’s there’, she added.

‘For non-transparent governments, connect with people who are behind facilitating negotiations for programmes like REDD to get insider view’, added Rina Tsubaki of European Forest Institute.

CARTO is the platform for turning location data into business outcomes.


What tools do you use when reporting on environmental data?


Here is what our data journalism community said they played with on a regular basis:

CARTO enriches your location data with versatile, relevant datasets, such as demographics and census, and advanced algorithms, all drawn from CARTO’s own Data Observatory and offered as Data as a Service.

QGIS is a free and open source geographic information system. It enables you to create, edit, visualise, analyse and publish geospatial information.

OpenStreetMap is a map of the world, created by members of the public and free to use under an open licence.

Google Earth Pro and Google Earth Engine help you create maps with advanced tools on PC, Mac, or Linux.

Datawrapper, an open source tool helping everyone to create simple, correct and embeddable charts in minutes.

R, Shiny and Leaflet with plugins were used to make these heatmaps of distribution of tree species in Bogotá.

D3js, a JavaScript library for visualizing data with HTML, SVG, and CSS.

Flourish makes it easy to turn your spreadsheets into world-class responsive visualisations, maps, interactives and presentations. It is also free for journalists.


Great examples of data journalism about the environment we’ve come across lately


How Much Warmer Was Your City in 2015?
By K.K. Rebecca Lai for The New York Times
Interactive chart showing high and low temperatures and precipitation for 3,116 cities around the world.
(shared by Gustavo Faleiros of InfoAmazonia)


What temperature in Bengaluru tells about global warming
By Shree DN for Citizen Matters
Temperature in Bengaluru was the highest ever in 2015. And February was the hottest. Do we need more proof of global warming?
(shared by Shree DN of Citizen Matters in India)


Data Science and Climate Change: An Audience Visualization
By Hannah Chapple for Affinio Blog
Climate change has already been a huge scientific and political topic in 2017. In 2016, one major win for climate change supporters was the ratifying of the Paris Agreement, an international landmark agreement to limit global warming.
(shared by Rina Tsubaki of European Forest Institute)


Google’s Street View cars can collect air pollution data, too
By Maria Gallucci for Mashable
“On the question of compelling environmental stories to prioritize, (this was a bit earlier in the thread) I feel like hyper-local air quality (what is happening on your street?) is powerful stuff. People care about what their family breathes in, and its an urgent health crisis. Google StreetView cars are now mapping this type of pollution in some places.”
(shared by James Anderson of Global Forest Watch)


This Is How Climate Change Will Shift the World’s Cities
By Brian Kahn for Climate Central
Billions of people call cities home, and those cities are going to get a lot hotter because of climate change.
(shared by Rina Tsubaki of European Forest Institute)


Treepedia :: MIT Senseable City Lab
Exploring the Green Canopy in cities around the world
(shared by Rina Tsubaki of European Forest Institute)


Losing Ground
By ProPublica and The Lens
Scientists say one of the greatest environmental and economic disasters in the nation’s history — the rapid land loss occurring in the Mississippi Delta — is rushing toward a catastrophic conclusion. ProPublica and The Lens explore why it’s happening and what we’ll all lose if nothing is done to stop it.
(shared by Elisabetta Tola of Formicablu)


Watergrabbing
A Story of Water, looks into the water-hoarding phenomenon. Every story explains a specific theme (transboundary waters, dams, hoarding for political and economic purposes), and shows the players involved, country-by-country. Take time to read and discover what water grabbing means. So that water can become a right for each country and every person.
(shared by Elisabetta Tola of Formicablu)


Ice and sky
By Wild-Touch
Discover the history and learn about climate changes — the interactive documentary
(shared by Gustavo Faleiros of InfoAmazonia)


Extreme Weather
By Vischange.org
The resources in this toolkit will allow communicators to effectively communicate extreme weather using strategically framed visuals and narratives. Watch the video to see it in action!
(shared by Rina Tsubaki of European Forest Institute)

Plus, there is a new version of Bear 71 available for all browsers:
Bear 71 VR
Explore the intersection of humans, nature and technology in the interactive documentary. Questioning how we see the world through the lens of technology, this story blurs the lines between the wild world, and the wired one.
(shared by Gustavo Faleiros of InfoAmazonia)


To see the full discussion, check out previous ones and take part in future ones, join the Data Journalism Awards community on Slack!


marianne-bouchart

Marianne Bouchart is the founder and director of HEI-DA, a nonprofit organisation promoting news innovation, the future of data journalism and open data. She runs data journalism programmes in various regions around the world as well as HEI-DA’s Sensor Journalism Toolkit project and manages the Data Journalism Awards competition.

Before launching HEI-DA, Marianne spent 10 years in London where she worked as a web producer, data journalism and graphics editor for Bloomberg News, amongst others. She created the Data Journalism Blog in 2011 and gives lectures at journalism schools, in the UK and in France.