Looking back on some tumultuous years in journalism, including Donald Trump’s campaign against fake news and the rise of the digital area, we asked Jimmy Wales, founder of Wikipedia and WikiTribune, five quick questions about his view on the current state of trust in journalism.
How would you describe the state of trust in journalism?
Journalism has been under huge financial pressure for a few years and somehow lost its way. However, trust is now starting to get back after the public realized that quality journalism matters.
Access to Wikipedia is free. Does that mean that trust is free?
Trust is about honesty and this does not really cost anything. The other way round, money can corrupt honesty.
How do you go about Fake News?
We have to manage them with trust. In the mainstream and quality media we’ve got to do all things right and share transcripts, audios, … things to prove what we are saying. Only this way we can restore trust and show the people that we are not simply making something up.
How do you verify data for Wikipedia?
We verify the data with very old-fashioned techniques, like transcripts, interviews and documents. All of this is very old-fashioned journalism. If you look at later techniques, data journalism, for instance, is a very important tool in journalism of the modern world. So much can be learned from large sets of data, particularly financial contributions to politicians. It is a rich source of very good information.
How do you see the future of journalism?
I am optimistic about journalism in the future because it is a core function in society. And even if the transition from digital business models has been very difficult, I do not think that the public does not care about the truth anymore. They do. We just have to find models to make it work!
Michaela Gruber is a journalism and media management student, based in Vienna, Austria. During her studies she spent a semester abroad in France, where she started working for HEI-DA.
As the company’s communication officer, she is in charge of the Data Journalism Blog and several social media activities. This year, Michaela was HEI-DA’s editor covering the Data Journalism Awards in Lisbon, Portugal.
Newspapers which tend to primarily focus on local issues, often represent the majority of media outlets in each country’s media landscape. They deliver a number of important journalistic functions, like holding local authorities to account, supporting democratic and civic needs and shaping the overall reputation of journalism. Thanks to their powerful human interest reporting, they shine a spotlight on local issues and offer unique local content that is is not necessarily found elsewhere.
As co-funder of the startup Urbs Media and director of the RADAR project, Alan Renwick has over 30 years experience in local, national and international news industries. Within his work, he provides local newsrooms with a regular feed of data-driven stories and scale up local news production by combining the work of journalists and Artificial Intelligence.
In this interview, he tells us why local journalists should not hesitate to use data within their work and how to turn national datasets into local content:
How can local journalists use data in their reporting?
There are many things that local journalists can do with data journalism. They already have their own data journalism efforts, like their own datasets, they are investigating their own local issues, and they have a lot of unique content. It is all just starting on a national level with national datasets but after that, local journalists have to unlock the fact that these datasets have got a lot of local information within them and can be used complementary to anything else they are doing. So they might put some local interviews around it or make some analysis and build it up in a much more colourful, local story.
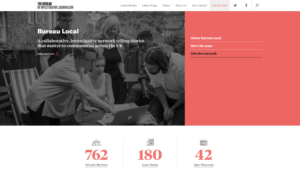
The Bureau Local is a collaborative, investigative journalism network in the UK which stands as a great example of how data journalism is thriving
You are the director of RADAR (Reports And Data And Robots), a news agency that combines humans and machines to deliver data-based news stories to local newsrooms. How can local journalists make use of those stories?
What we do with RADAR is to hopefully give those local newsrooms skills and raw material to work with. This comes in form of a regular feed of data- driven stories for that they might normally not have the time and resources to look at. The reason for that is that most of them have quite a high philosophy behind them and there is a high number of data stories around.
So, what we actually do then is to take national datasets and do a fusion of local and national journalism. That means, we try to understand the generics of national data and see how these stories might vary for every local area. Then we look at the different variables to figure out how many different outcomes there might be and write story templates for every eventuality. For instance, we might put the numbers from a spreadsheet into a sentence such as “since w, house prices in x have increased by y/fallen by z/stayed the same”. This means that if you have 500 rules you might have 500 different stories. From the same data you might have different types of stories with different headlines and different content.
RADAR is a collaboration between the Press Association and Urbs Media that delivers news stories to local media, combining the work of humans and machines.
What is your top advice for local journalists who want to work with data?
Many local newsrooms want to write very few numbers into their stories even if all the sources come from data. That is why my advice for local journalists is to treat data journalism just like any other source. There might be a broader, softer story that comes from it. They just have to understand the genesis of it, where it comes from, then integrate it, be sure of what it means, what the facts are and then create the story in their very traditional way.
Learn the data skills but as you use them, use them in the way that you would use any other source.
Michaela Gruber is a journalism and media management student, based in Vienna, Austria. During her studies she spent a semester abroad in France, where she started working for HEI-DA.
As the company’s communication officer, she is in charge of the Data Journalism Blog and several social media activities. This year, Michaela was HEI-DA’s editor covering the Data Journalism Awards in Lisbon, Portugal.
We asked Bella Hurrell, Deputy Editor of the BBC News Visual Journalism Team, about what makes a good product prototype and what are the challenges that you have to face when building them. In this video, she shares with us the tools that the BBC uses for building their prototypes and what their vision is.
Build quick and dirty prototypes that you can test with people. Don’t invest huge amounts of time in something if you are not that sure about it […] and give up when it is a good time to do it!
Michaela Gruber is a journalism and media management student, based in Vienna, Austria. During her studies she spent a semester abroad in France, where she started working for HEI-DA.
As the company’s communication officer, she is in charge of the Data Journalism Blog and several social media activities. This year, Michaela was HEI-DA’s editor covering the Data Journalism Awards in Lisbon, Portugal.
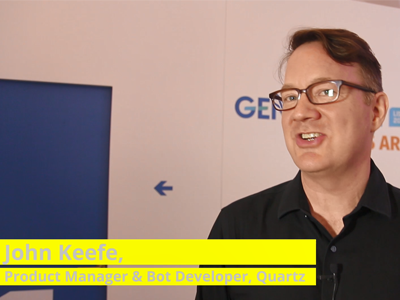
When talking to John Keefe, Product Manager & Bot Developer at Quartz, he encourages the journalism community to experiment with chat bots and try different tools. In this video, he shares some tips and tricks with us on what platforms to use and how journalists can build chat bots themselves.
Building chat bots is not as hard as it seems!
I would say, just give it a try!
Michaela Gruber is a journalism and media management student, based in Vienna, Austria. During her studies she spent a semester abroad in France, where she started working for HEI-DA.
As the company’s communication officer, she is in charge of the Data Journalism Blog and several social media activities. This year, Michaela was HEI-DA’s editor covering the Data Journalism Awards in Lisbon, Portugal.
How easy (or difficult) is it to access data in China, Malaysia, Kenya, and other countries? Are there tested business models for data journalism in different parts of the world? How do you promote data literacy in newsrooms where innovation is not a priority? We’ve gathered international experts to tackle those questions, and discuss government interference, the pace of learning, and managerial issues.
Darren Long, head of graphics at South China Morning Post (Hong Kong), Kuek Ser Kuang Keng from Data N and former Google fellow at PRI (Malaysia), Eva Constantaras, Google Scholar from Internews and expert in data journalism for Africa, Asia and South America (originally from Greece), and Yolanda Ma from Data Journalism China, also jury member of the Data Journalism Awards competition (China), all joined us, as well as participants from other countries.
From left to right: Darren Long, Yolanda Ma, Eva Constantaras and Kuek Ser Kuang Keng
How widespread would you say data journalism is in your region?
Kuek Ser Kuang Keng: People like to see Southeast Asia as a ‘region’ but the fact is countries in this region are very diverse in terms of development stage, politics, and technology. So there’s no way to generalise them.
In Malaysia, my own country, data journalism is almost non-existent; there are only infographics. There is a strong interest among a small group of journalists, but they lack support from editors and management, who focus more on social media. Innovation in journalism is not prioritised. In neighbouring countries, such as Indonesia and the Philippines, things might be a little better, but they are still relatively far behind the West. In non-democratic countries where free press is always under siege like Cambodia, Vietnam, Laos, and Thailand, the landscape is totally different. There, the survival of independent journalism is above all other things like innovation.
Darren Long: It’s a good point. I was going to say Europe and America can feed off each other through the use of English language and a common Roman script whereas Asia is much more diverse. Press freedom is certainly an issue. Even in Hong Kong where we have a feisty and largely free press.
Visual journalism and the use of data is a good way to avoid government interference though. If you can use data to make your point from government sources, there is little they can criticise. The problem is getting public and government data. It is very hard to get consistent and reliable sources from Mainland China.
Yolanda Ma: In mainland China, since data journalism was introduced five years ago, it has been widely accepted and adopted by media organisations, from official newspapers to commercialised online portals. The development is limited due to the cost (both technical and human resources). It is more recognised by the industry than by the public.
Eva Constantaras: My specialty is introducing data journalism in countries where it basically doesn’t exist. General trends I see are: publishers get excited because it sounds digital and visual and sexy, mid-level editors and senior reporters are in denial about digital convergence and are afraid of it so don’t want to know anything about it, and early career journalists are excited about it for three reasons: 1. They want to still have a job once digital convergence happens 2. They think data visualisation looks fun and 3. (least common) they see how data can enrich their public interest reporting by making their stories more analytical.
How accessible is public data in your country? What advice do you have on how to access data (public or else)?
Darren Long: We have freedom of information but it’s a fine line.
Kuek Ser Kuang Keng: There’s no FOI in Malaysia, Singapore and other non-democractic Southeast Asian countries but it exists in Indonesia and the Philippines. While sensitive information is not available, Malaysia and Singapore governments do publish a lot of data online. Both countries have a dedicated open data portal and relevant policies.
However media in both countries don’t have a strong demand for government data nor the skill, knowledge, and habit to use data in their reporting. The main demand comes from the business/IT community which is adopting business analytics very fast. So before talking about accessing any data, there need to be awareness, skill, and knowledge within newsrooms on data journalism. It seems like this awareness is higher in Indonesia and the Philippines. There’s a specialised business data news startup in Indonesia called Katadata, that you may want to check out:
Eva Constantaras: The first excuse I get from journalists for not doing data journalism is that there isn’t enough data. In all the countries I have been in, I would not say that is among even the top 3 challenges. And partially that’s because nobody has ever used the little data there is, so they need to build up demand in order for more data to be released. The biggest challenge is finding journalists who are willing to abandon their jobs as stenographers and embrace their role as knowledge producers. This is not a problem data or technology can solve.
Darren Long: I agree with that. I find a lot of the problem is more about thinking how to visualise data in a creative manner than the non-existence of data.
Yolanda Ma: People usually have the impression that China doesn’t have much data but the reality is quite the opposite. There is tons of data, just not well published and usually unstructured. Sometimes the data is inaccurate and not reliable. There is a FOI regulation and media do use it for stories, but less for data.
But things are getting better, compared with five years ago. In China more data is released (effort has been made to convince government and also help them to get it right), the open data movement is still on and pushing for better data culture, especially collaboration between universities, companies, government, but also NGOs and citizens.
What are the main challenges data journalists face in your region?
Eva Constantaras: I think journalists underestimate the work that goes into a data story. It’s not enough to just use data to reveal the problem because of the ubiquity of corruption in so many countries. For a story to have an impact and get people’s attention, it has to measure the problem, the causes, the impact on citizens and potential solutions. That’s more work than journalists are used to. Many journalists just want to make visualisations. I tell them visualisations are the paint on the house. Their house can be a beautiful colour but if their analysis is bad, their structure is unsound, their pretty house will fall down.
Darren Long: Technology has been an issue for us. We have to create our infographics outside the company CMS and redirect the page. If we weren’t so stubborn we would have given up long ago
Kuek Ser Kuang Keng: Newsroom managers don’t have much awareness of data journalism and the digital disruption has put news companies in a tough position financially. The limited resources that news companies can allocate have been put into ‘hot’ fields like social media and video. A good number of journalists are eager to learn new skills but they don’t get much support to pick up new skills and put those skills into use. I wish technology was an issue in Malaysia. We don’t even have data or interactive team in newsrooms here. I’m the only data journalist in Malaysia.
Yolanda Ma: Talent is an issue everywhere, but the challenge beyond that is the cost — the cost to develop the skills and to maintain such a team in the newsroom. Many data stories in China are now going video or motion graphics as well to stay aligned with consumer trends.
Here is an example of data journalism on TV:
Parcels from Faraway Places (subtitles in English)
How do you overcome these challenges? What creative solutions could we find for them?
Kuek Ser Kuang Keng: How to overcome? I find the main hurdle lies with managers and editors, so I would approach them to provide them a better understanding of data journalism — the potential, impacts and costs, or talent needed. Another good way is to build networks among journalists who share the same interests, so they can support each other, and exchange ideas on how to convince their bosses.
Money is a huge problem in Malaysia. The digital disruption has put news companies in a tough position financially. They want something that can see quick returns, often financially
Eva Constantaras: I think we have to abandon the myth that learning data journalism is ‘fast’, something that can be picked up at a bootcamp. Someone should do a data study of how many data journalists come out of bootcamps. And how many statistically unsound stories came out by the few who did manage to produce a data story.
We want data journalism to be taken seriously so we need a serious approach to capacity building. I have a 200-hour training and production model bringing together journalists, civic hackers, and CSOs with data that has worked in a couple of countries but usually because we found committed journalists who were willing to be the lone data journalist in their newsroom. And we do a lot of outreach and convincing of editors and publishers.
Are there any tested business models (other than grants) for data journalism in developing countries?
Question from Stephen Edward (Astat Consulting, India)
Kuek Ser Kuang Keng: Unfortunately, not that I know of, but you can keep a watch on Katadata, a specialised data business news startup in Indonesia. They will increase their monetisation efforts soon.
Eva Constantaras: The only media outlet in a developing country that really sees a lot of revenuee coming from their data work is Nation Newsplex in Kenya, and part of that is because the Nation Media Group can repurpose the online data content for two different print publications and their television station. It’s still a very small team.
Donor support is also often not well structured. They want to give data reporting grants in countries without data reporters. Or they want to give funding for one-off projects that then die a slow death. It’s expensive to train and sustain a data team and most donors don’t make that investment.
Yolanda Ma: One business model that a newsroom is trying (not proved yet) is the think tank approach — they really specialised in urban data, so by digging into data and finding trends, they can actually provide the product for policy makers, urban design industry, etc.
When one data team do very well within the news organisations — another way to go is to spin off. Caixin’s former data head set up his own company last year and it provides service to other media organisations on data stories production now.
The good thing about spinning off is that you do not need to only do journalism projects — which are usually not that profitable. But by being independent you can do commercial projects as well.
Eva Constantaras: The nice thing about spinning off is also then data content can be distributed through a variety of popular media and reach a larger audience.
What can we do to get more high quality data journalism projects from the Global South? And, given that it is harder for the Global South to compete with the Global North, is there a way to build more recognition for the south?
Question from Ben Colmery (ICFJ Knigt Felllowships director, USA)
Yolanda Ma: There are some quite high quality data journalism projects in the South and they don’t have to compete with the North.
Kuek Ser Kuang Keng: As I mentioned earlier, there are far less reporting about the innovations including data journalism projects done by news organisation in Asia. We don’t have Nieman Lab or Poynter here (fortunately we still have djchina.org but it is in Chinese). There are good projects, often done in tough environment, but they don’t get much attention outside of their own country. I can see more and more projects from Latin America were featured in journalism portals but that kind of treatment has not reached Asia. However, language remains a challenge.
Eva Constantaras: I am not sure why they would need to compete since they have different audiences. Though one revenue model I am very interested in is encouraging Western media outlets to buy content from data journalists in the Global South instead of parachutting in their own expensive journalists who do superficial stories.
I think now the West has realized that it needs to do more data-driven reporting on the local level for rural and less educated audiences about issues they care about. I think that the value of data journalism in developing countries is exposing the roots of inequality and helping citizens make better decisions and push for a more accountable government on a local level. Those projects don’t have to be flashy. They just have to be effective and accurate.
Darren Long: I think what international news outlets do well is broad comparative visualisations based around strong concepts. I think we tend to over rely on charts and graphics in Asia.
What is interesting right now is how a market like China has incredibly deep reach through mobile phones. Massive markets do everything on their phone. The tier one cities are easily as sophisticated as the West in that area.
So if we can leverage consumption of dataviz on mobile there should be a massive appetite
Can you share one tip you wish you’d been given about data journalism in the region you work in?
Yolanda Ma: I’d say, in Asia, do start looking for opportunities for cross-border data stories.
Eva Constantaras: Identify questions that citizens need answered to improve their quality of life and build your data stories around answering those questions.
Kuek Ser Kuang Keng: Data journalism takes time and patience. Visualisation is usually the quickest and easiest part!
Yolanda Ma: To echo Eva’s point — yes, don’t just produce meaningless fancy visuals.
Examples of data journalism from around the world that you should go and check out:
Darren Long: The Singapore Reuters office is producing some stunning multimedia data visualisations.
Here’s one they did on the oil spill off China:
But they have international resources and can recruit from all over the world
Here’s an example of a story we did at South China Morning Post. The data was from the government, but they didn’t like the story. If you click on our source, the page opens with a great big disclaimer they added after we didnt take our page down:
The map itself is still up:
A few more that I like:
Kuek Ser Kuang Keng: Tempo is a highly respectable magazine in Indonesia that produces great investigative reports. But most of their data journalism projects are on print. Here’s a deck shared by their editor-in-chief that showcase some of their data stories.
Malaysiakini is also working hard in data journalism. I recently collaborated with them to produce the first newsgame in Malaysia. It explains the issue of malapportionment in Malaysian election system.
Yolanda Ma: Here is a deck I made on data journalism in China a year ago — it serves as a good overview for anyone who’s interested:
Other organisations from China you should check out: Caixin, the Paper/SixthTone, Yicai, DT.
I like IndiaSpend in India and Katadata in Indonesia too.
Eva Constantaras: Here’s an example of a story that might have been risky without government data:
Some of my favourites are IndiaSpend and Hindustan Times in India, Daily Nation Newsplex in Kenya, Ojo Publico in Peru and both La Nacion Argentia and Costa Rica.
Kuek Ser Kuang Keng: I agree with Yolanda and Eva, at the reporter level, a good number of journalists are eager to learn a new skill but they don’t get much support from editors or managers to pick up new skills and put those skills into use.
I would recommend Rappler in the Philippines, Katadata and Tempo in Indonesia. But only Katadata has a dedicated vertical for data stories
Over the past six years, the Global Editors Network has organised the Data Journalism Awards competition to celebrate and credit outstanding work in the field of data-driven journalism worldwide. To see the full list of winners, read about the categories, join the competition yourself, go to our website.
Peter Aldhous of BuzzFeed News and Simon Rogers of the Google News Initiative discuss the power of machine learning in journalism, and tell us more about the groundbreaking work they’ve done in the field, dispensing some tips along the way.
Machine learning is a subset of AI and one of the biggest technology revolutions hitting the news industry right now. Many journalists are getting excited about it because of the amount of work they could get done using machine learning algorithms (to scrape, analyse or track data for example). They enable them to do tasks they couldn’t before, but it also raises a lot of questions about ethics and the ‘reliance on robots’.
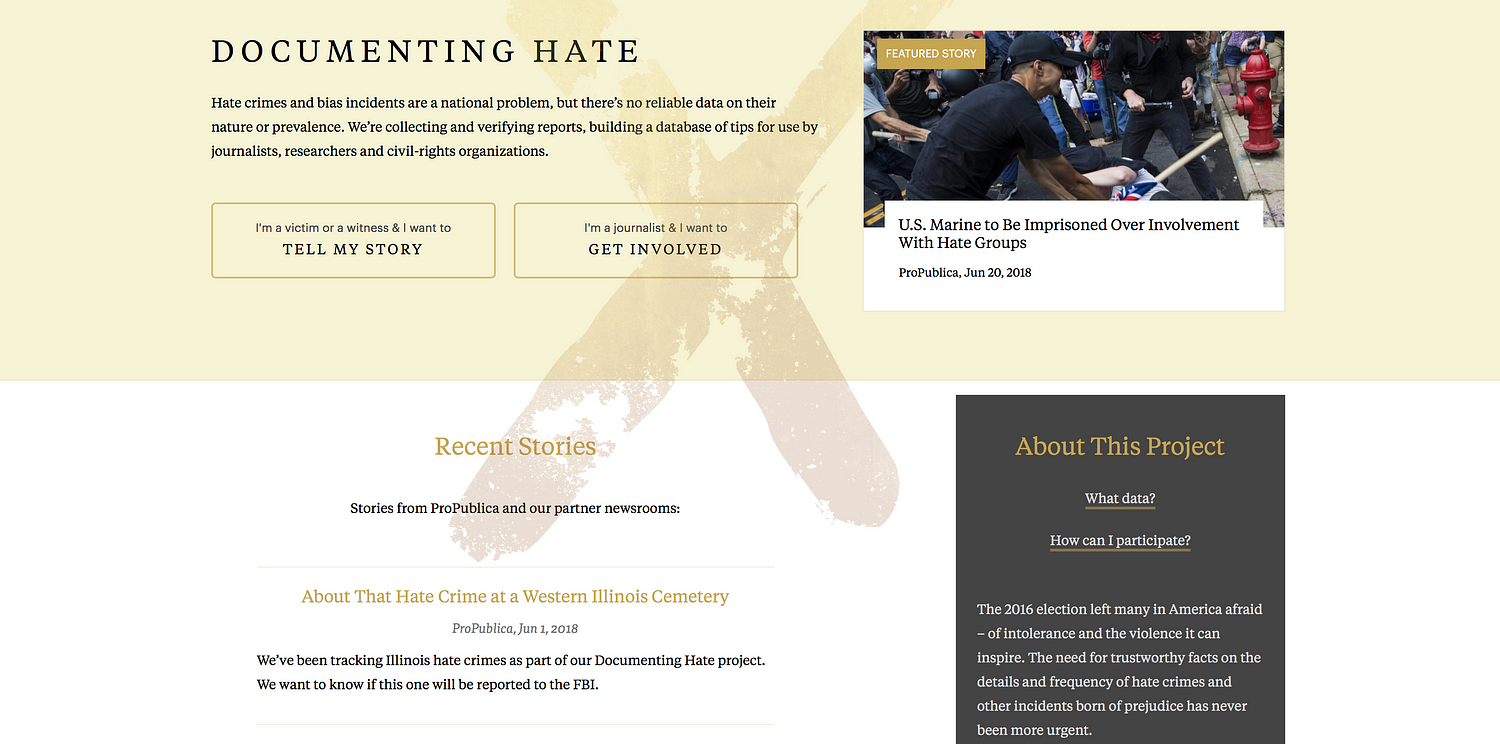
Peter Aldhous is the brain behind BuzzFeed News’s machine learning project ‘Hidden Spy Planes’. The investigation revealed how US airspace is buzzing with surveillance aircraft operated for law enforcement and the military, from planes tracking drug traffickers to those testing new spying technology. Simon Rogers is data editor for Google (who’s also been contributing to some great work on machine learning, including ProPublica’s Documenting Hate project which provides trustworthy facts on the details and frequency of hate crimes).
What is it about AI that gets journalists so interested? How can it be used in data journalism?
Peter Aldhous: I think the term AI is used way too widely, and is mostly used because it sounds very impressive. When you say ‘intelligence’, mostly people think of higher human cognitive functions like holding a conversation, and sci-fi style androids.
But as reporters, we’re often interested in finding the interesting things from a mass of data, text, or images that’s too big to go through manually. That’s something that computers, trained in the right way, can do well.
And I think machine learning is a much more descriptive and less pretentious label for that than AI.
Simon Rogers: There is a big gap between what we’ve been doing and the common perception of self aware machines. I look at it as getting algorithms to do some of the more tedious work.
Why and when should journalists use machine learning?
P.A.: As a reporter, only when it’s the right tool for the job — which likely means not very often. Rachel Shorey of The New York Times was really good on this in our panel on machine learning at the NICAR conference in Chicago in March 2018.
She said things that have solved some problems almost as well as machine learning in a fraction of the time:
– Making a collection of text easily searchable;
– Asking a subject area expert what they actually care about and building a simple filter or keyword alert;
– Using standard statistical sampling techniques.
What kind of ethical/security issues does the use of machine learning in journalism rise?
P.A.: I’m very wary of using machine learning for predictions of future events. I think data journalism got its fingers burned in the 2016 election, failing to stress the uncertainty around the predictions being made.
There’s maybe also a danger that we get dazzled by machine learning, and want to use it because it seems cool, and forget our role as watchdogs reporting on how companies and government agencies are using these tools.
I see much more need for reporting on algorithmic accountability than for reporters using machine learning themselves (although being able to do something makes it easier to understand, and possible to reverse engineer.)
If you can’t explain how your algorithm works to an editor or to your audience, then I think there’s a fundamental problem with transparency.
I’m also wary of the black box aspect of some machine learning approaches, especially neural nets. If you can’t explain how your algorithm works to an editor or to your audience, then I think there’s a fundamental problem with transparency.
S.R.: I agree with this — we’re playing in quite an interesting minefield at the moment. It has lots of attractions but we are only really scratching the surface of what’s possible.
But I do think the ethics of what we’re doing at this level are different to, say, developing a machine that can make a phone call to someone.
‘This Shadowy Company Is Flying Spy Planes Over US Cities’ by BuzzFeed News
What tools out there you would recommend in order to run a machine learning project?
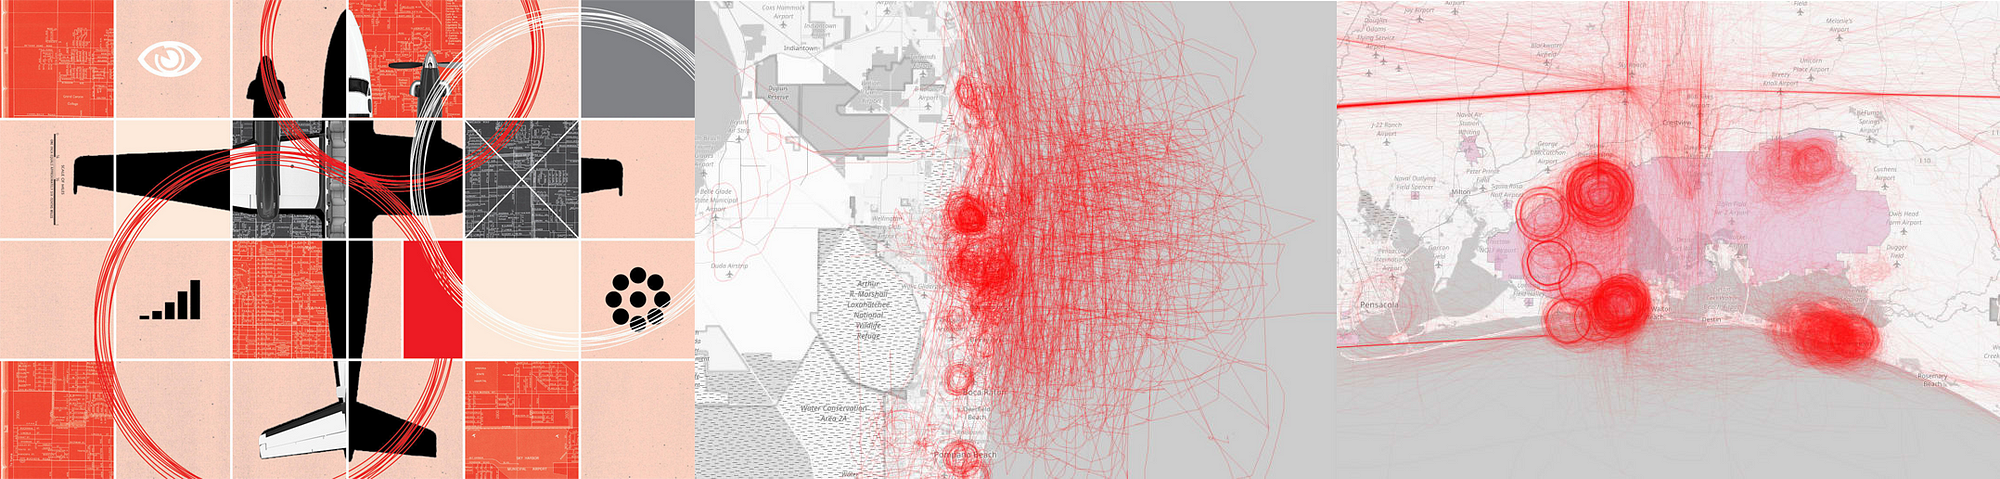
P.A.: I work in R. Also good libraries in Python, if that’s your religion. But the more difficult part was processing the data, thinking about how to process the data to give the algorithm more to work with. This was key for my planes project. I calculated variables including turning rates, area of bounding box around flights, and then worked with the distribution of these for each planes, broken into bins. So I actually had 8 ‘steer’ variables.
This ‘feature engineering’ is often the difference between something that works, and something that fails, according to real experts (I don’t claim to be one of those). More explanation of what I did can be found on Github.
There is simply no reliable national data on hate crimes in the US. So ProPublica created the Documenting Hate project.
S.R.: This is the big change in AI — the way it has become so much easier to use. So, Google hat on, we have some tools. And you can get journalist credits for them.
With Documenting Hate, we were concerned about having too much confidence in machine learning ie restricting what we were looking for to make sure it was correct.
ProPublica’s Scott Klein referred to it as an ‘over eager student’, selecting things that weren’t right. That’s why our focus is on locations and names. Even though we could potentially widen that out significantly
P.A.: I don’t think I would ever want to rely on machine learning for reporting. To my mind, its classifications need to be ground-truthed. I saw the random forest model used in the ‘Hidden Spy Planes’ story as a quick screen for interesting planes, which then required extensive reporting with public records and interviews.
What advice do you have for people who’d like to use machine learning in their upcoming data journalism projects?
P.A.: Make sure that it is the right tool for the job. Put time into the feature engineering, and consult with experts.
You may or may not need subject matter expert; at this point, I probably know more about spy planes than most people who will talk about them, so I didn’t need that. I meant an expert in processing data to give an algorithm more to work with.
Don’t do machine learning because it seems cool.
Use an algorithm that you understand, and that you can explain to your editors and audience.
Right tool for the job? Much of the time, it isn’t.
Don’t do this because it seems cool. Chase Davis was really good in the NICAR 2018 panel on when machine learning is the right tool:
Is our task repetitive and boring?
Could an intern do it?
If you actually asked an intern to do it, would you feel an overwhelming sense of guilt and shame?
If so, you might have a classification problem. And many hard problems in data journalism are classification problems in disguise.
We need to do algorithmic accountability reporting on ourselves! Propublica has been great on this:
But as we use the same techniques, we need to hold ourselves to account
S.R.: Yep — this is the thing that could become the biggest issue in working with machine learning.
What would you say is the biggest challenge when working on a machine learning project: the building of the algorithm, or the checking of the results to make sure it’s correct, the reporting around it or something else?
P.A.: Definitely not building the algorithm. But all of the other stuff, plus feature engineering.
S.R.: We made a list:
We wanted to be sure, so we cut stuff out.
We still need to manually delete things that don’t fit.
Critical when thinking about projects like this — the map is not the territory! Easy to conflate amount of coverage with amount of hate crimes. Be careful.
Always important to have stop words. Entity extractors are like overeager A students and grab things like ‘person: Man’ and ‘thing: Hate Crime’ which might be true but aren’t useful for readers.
Positive thing: it isn’t just examples of hate crimes it also pulls in news about groups that combat hate crimes and support vandalized mosques, etc.
It’s just a start: more potential around say, types of crimes.
I fear we may see media companies use it as a tool to cut costs by replacing reporters with computers that will do some, but not all, of what a good reporter can do, and to further enforce the filter bubbles in which consumers of news find themselves.
Hopes & wishes for the future of machine learning in news?
P.A.: I hope we’re going to see great examples of algorithmic accountability reporting, working out how big tech and government are using AI to influence us by reverse engineering what they’re doing.
Julia Angwin and Jeff Larson’s new startup will be one to watch on this:
I fear we may see media companies use it as a tool to cut costs by replacing reporters with computers that will do some, but not all, of what a good reporter can do, and to further enforce the filter bubbles in which consumers of news find themselves.
Here’s a provocative article on subject matter experts versus dumb algorithms:
Peter Aldhous tells us the story behind his project ‘Hidden Spy Planes’:
‘Back in 2016 we published a story documenting four months of flights by surveillance planes operated by FBI and Dept of Homeland Security.
I wondered what else was out there, looking down on us. And I realised that I could use aspects of flight patterns to train an algorithm on the known FBI and DHS planes to look for others. It found a lot of interesting stuff, a grab bag of which mentioned in this story.
But also, US Marshals hunting drug cartel kingpins in Mexico, and a military contractor flying an NSA-built cell phone tracker.’
Should all this data be made public?
Interestingly, the military were pretty responsive to us, and made no arguments that we should not publish. Certain parts of the Department of Justice were less pleased. But the information I used was all in the public, and could have been masked from flight the main flight tracking sites. (Actually DEA does this.)
US Marshals operations in Mexico are very controversial. We strongly feel that highlighting this was in the public interest.
About the random forest model used in BuzzFeed’s project:
Random forest is basically a consensus of decision tree statistical classifiers. The data journalism team was me, all of the software was free and open source. So it was just my time.
The machine learning part is trivial. Just a few lines of code.
If you had had a team to help with this, what kinds of people would you have included?
Get someone with experience to advise. I had excellent advice from an academic data scientist who preferred not to be acknowledged. I did all the analysis, but his insights into how to go about feature engineering were crucial.
Marianne Bouchart is the founder and director of HEI-DA, a nonprofit organisation promoting news innovation, the future of data journalism and open data. She runs data journalism programmes in various regions around the world as well as HEI-DA’s Sensor Journalism Toolkit project and manages the Data Journalism Awards competition.
Before launching HEI-DA, Marianne spent 10 years in London where she worked as a web producer, data journalism and graphics editor for Bloomberg News, amongst others. She created the Data Journalism Blog in 2011 and gives lectures at journalism schools, in the UK and in France.
The Winter Olympics 2018 in PyeongChang, South Korea, are just a few weeks away, and the football world cup 2018 is not far off either. While many journalists around the world are preparing their coverage, we wonder: how do you get ready for these big sporting events? What’s the difference between a sports data journalism project and any other data project? Where do you find data and analytics on this topic?
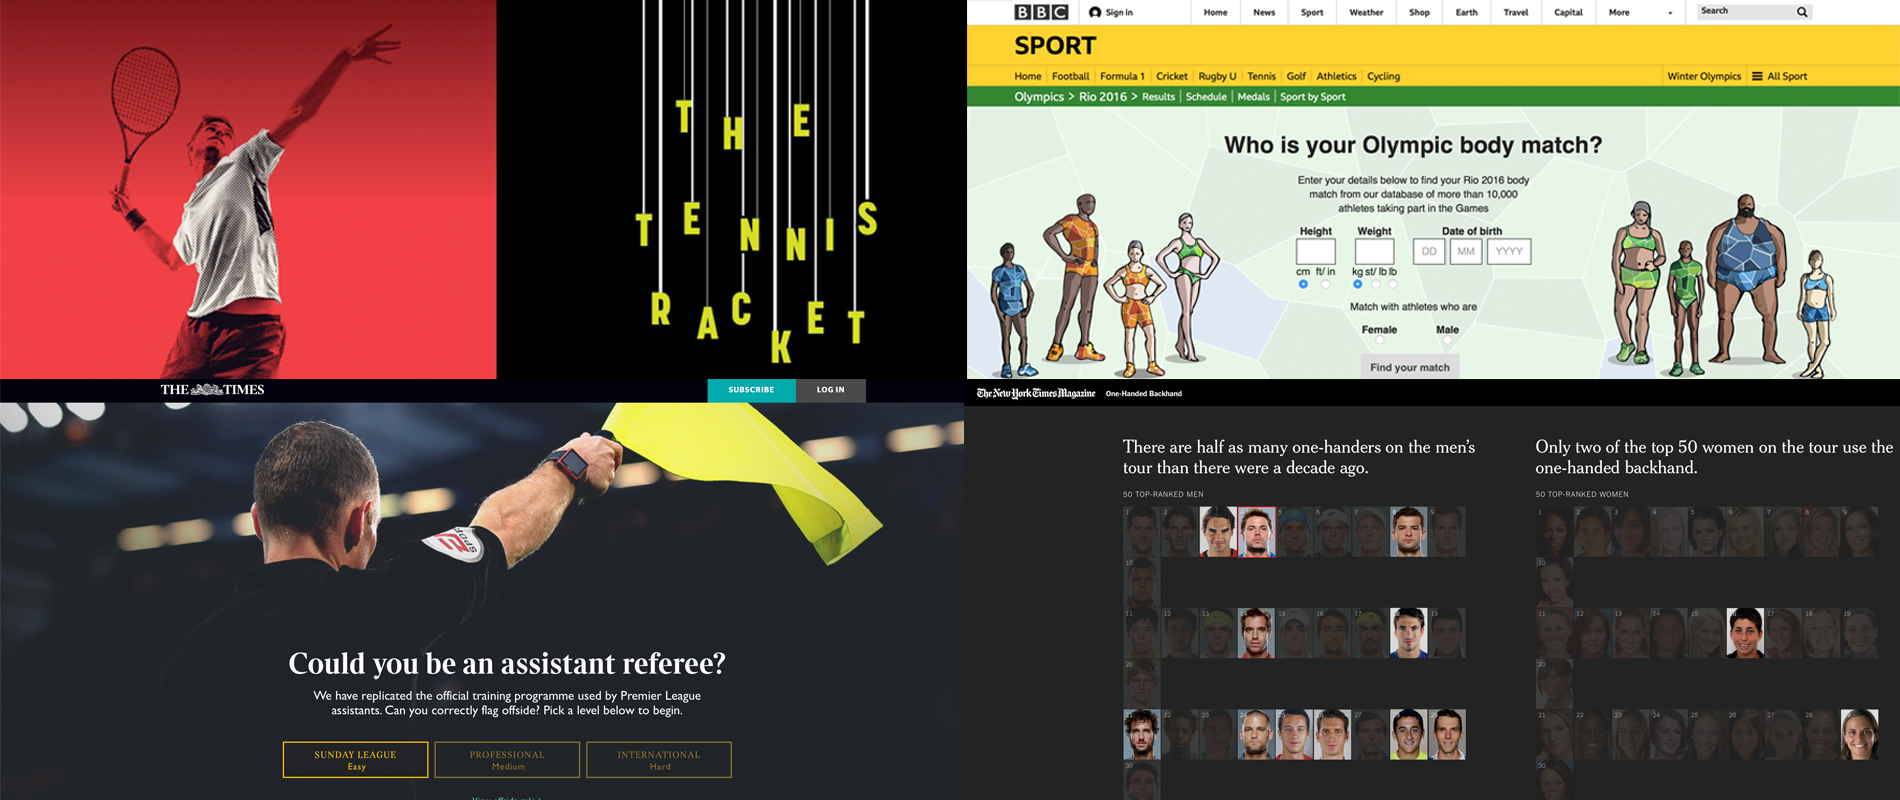
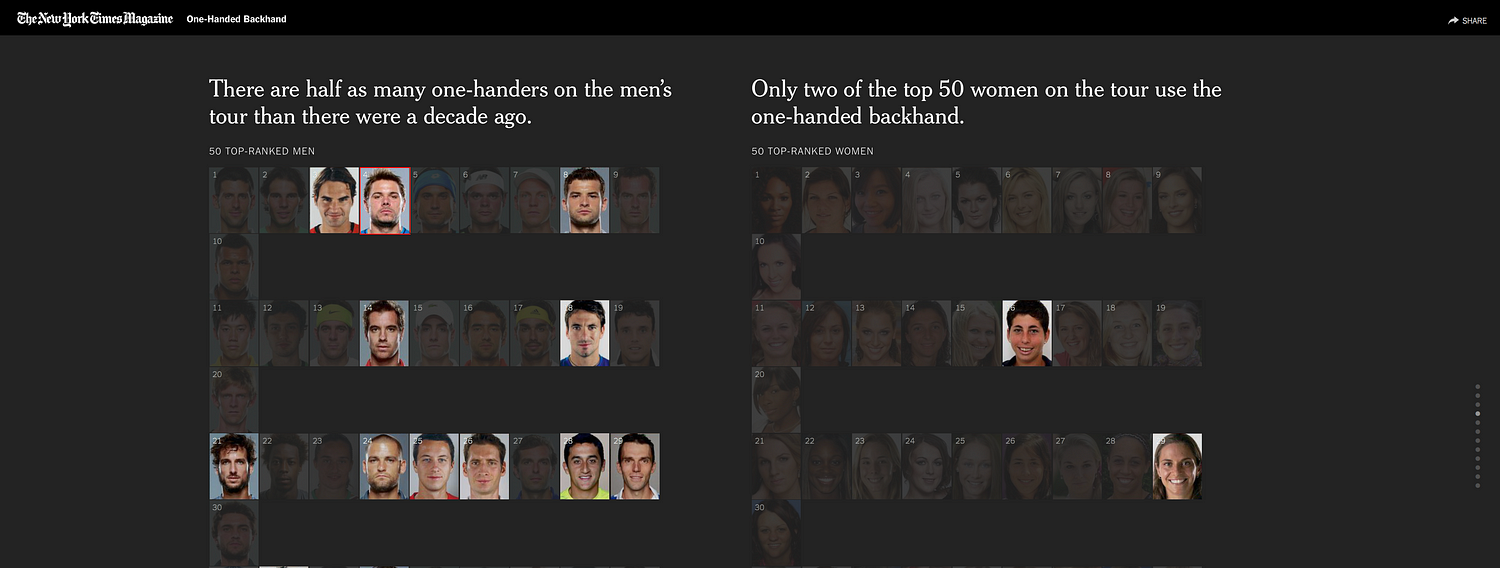
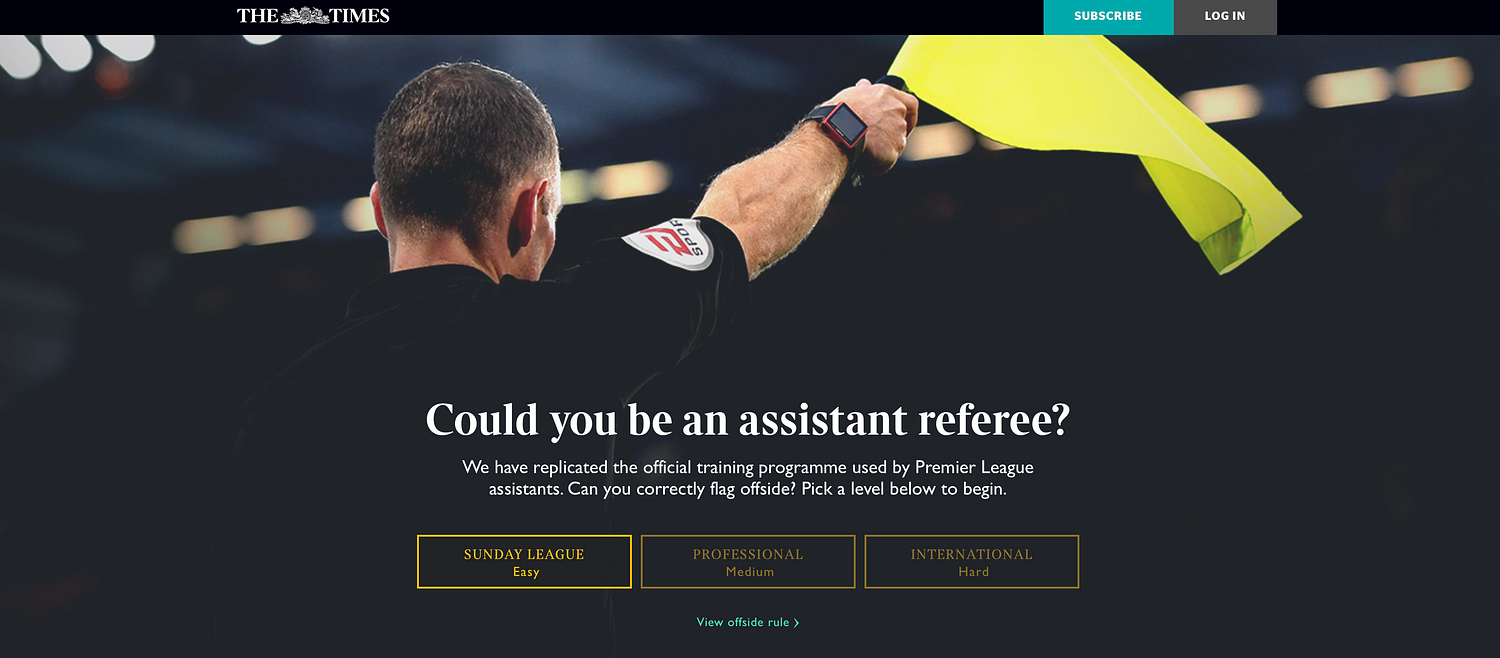
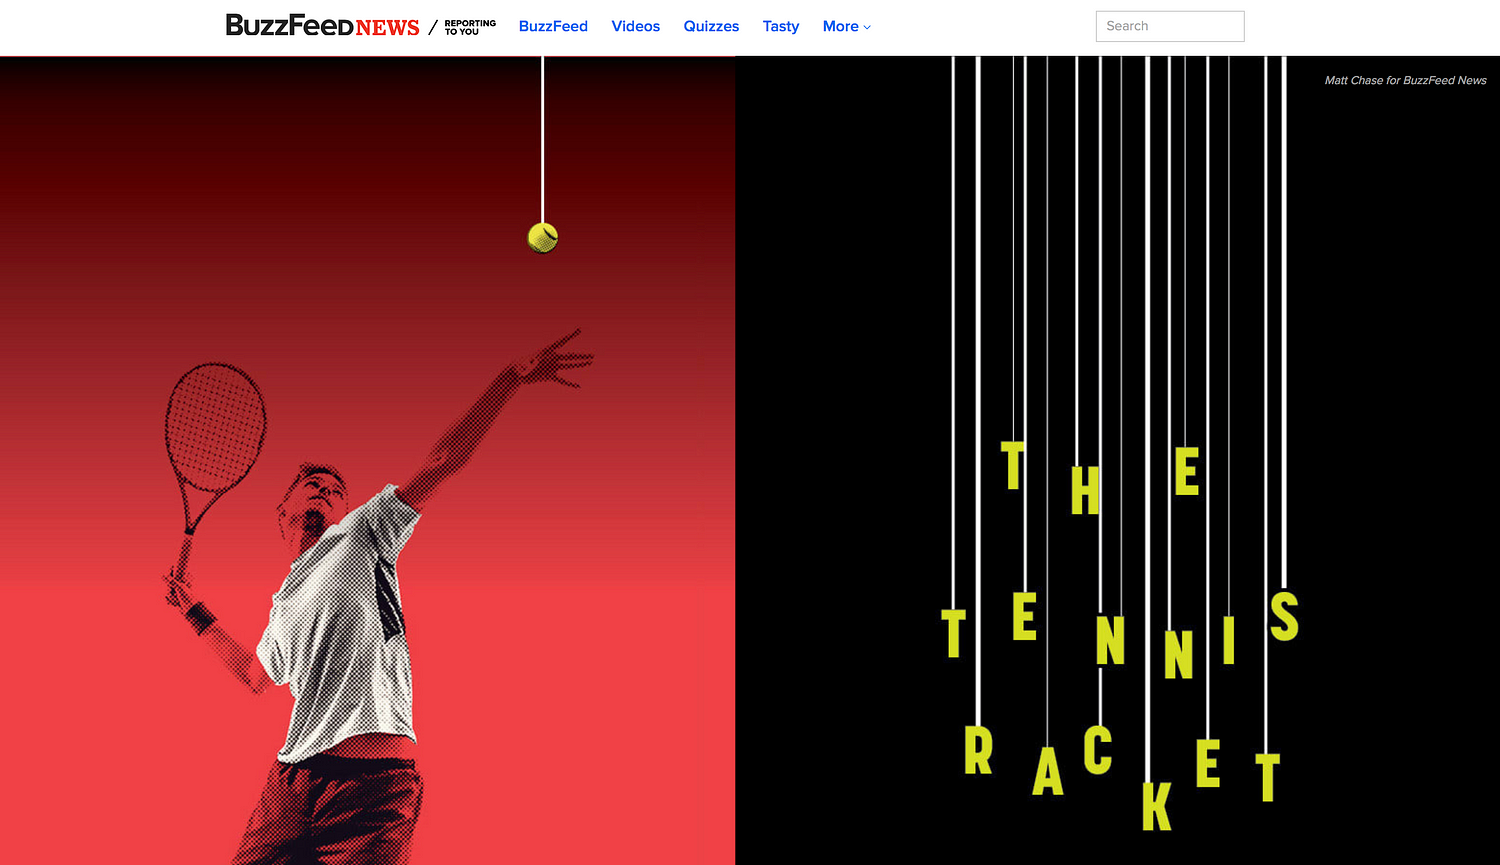
From top left, clockwise: ‘The Tennis Racket’ project by BuzzFeed News, ‘Who is your Olympic body match?’ by the BBC, the ‘One-handed backhand’ project by The New York Times, and ‘Could you be an assistant referee?’ by The Times.
We’ve gathered four experts from both sides of the pond to answer these questions and share tips on how to best work with sports data in the newsroom.
Steve Doig from ASU’s Cronkite School of Journalism (US), Paula Lavigne from ESPN (US), Nassos Stylianou from the BBC (UK), and Malcolm Coles, digital publishing strategy consultant, formerly with the Telegraph and the Trinity Mirror (UK), all joined the conversation. Here is a compilation of what we’ve learned.
The main differences between sports data and other types of data
All our experts agreed that working with sports data is a little different from working with any other types of data.
Here are the four main differences they pointed out during our discussion:
You don’t have to have a public records fight to get it
The problem with sports data is that there’s such a flood of it that people are still trying to find ways to get good signal out of all the noise
The data is often very granular (up-to-the-minute data, or even up-to-the-second data, is quite common)
Fans have a huge interest in it
“Sports is the one part of a news organisation where the consumers really care about numbers. It’s a lot harder to sell a data story in other news contexts,” Steve Doig (ASU’s Cronkite School of Journalism, US).
The fastest 100m times ever. Those caught doping struck out in red.
As the example above shows, there’s a whole data ecosystem of what you can call the ‘obsessed fans’, some of whom ‘have gone on to create viable business models of gathering and adding value to the raw data’, Doig argued.
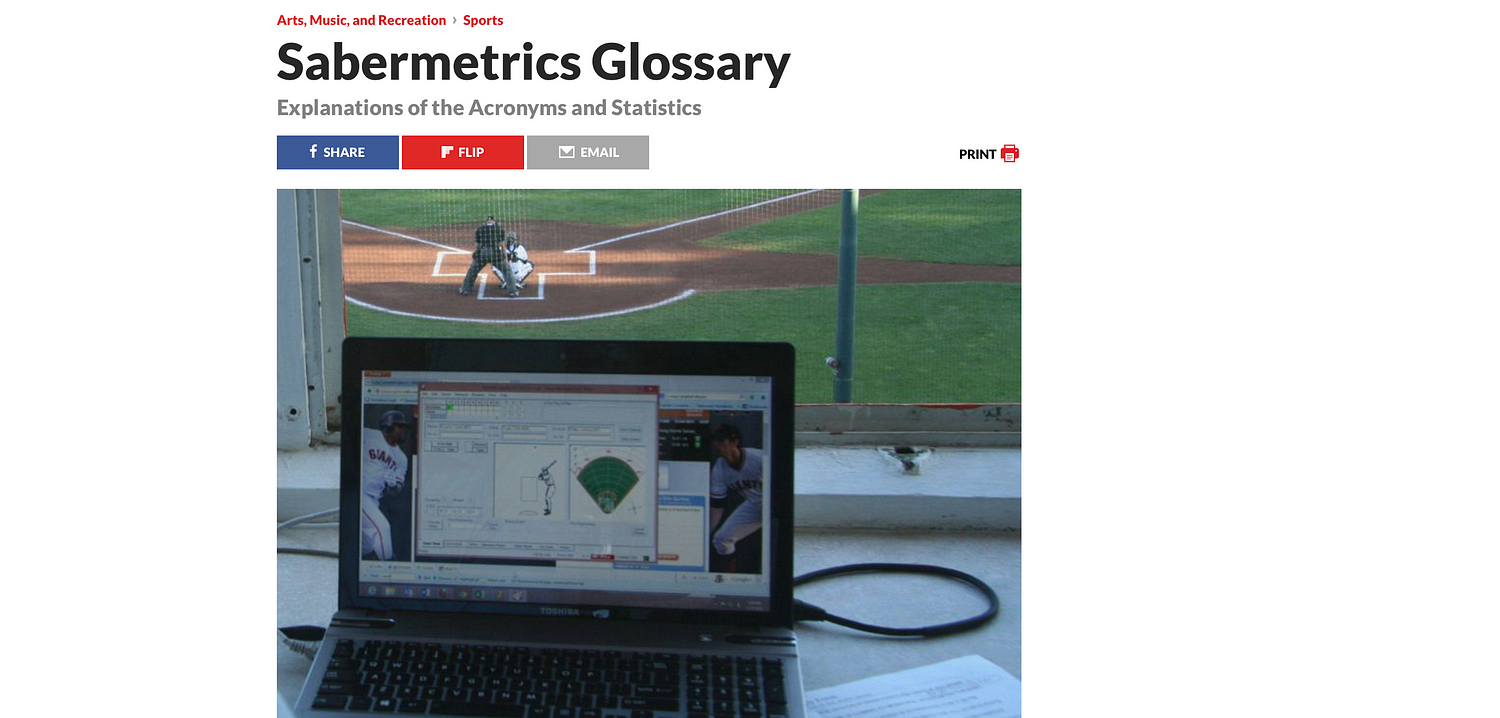
Steve Doig shared with us this glossary of some “moneyball” metrics that have been created, often by fans rather than the pros themselves
Where do you find sports data?
“In the US, certainly, the major pro sports leagues have opened up their data streams to just about anyone…and much of it can be played with using simple computer tools like Excel,” Steve Doig (ASU’s Cronkite School of Journalism, US).
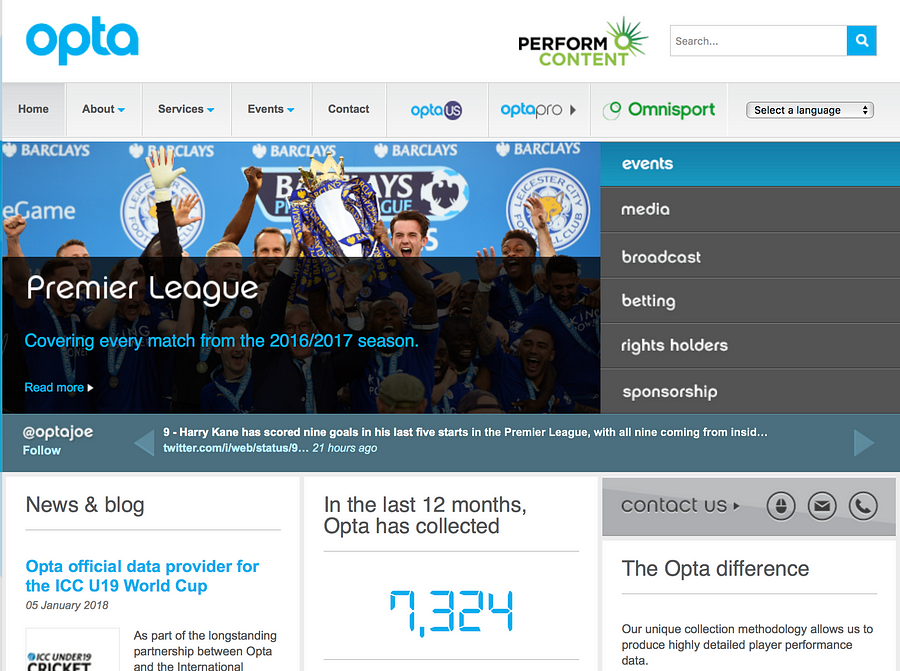
Opta is the world’s leading live, detailed sports data provider. A lot of their stats are proprietary, but a lot of news organisations in the world have agreements with them.
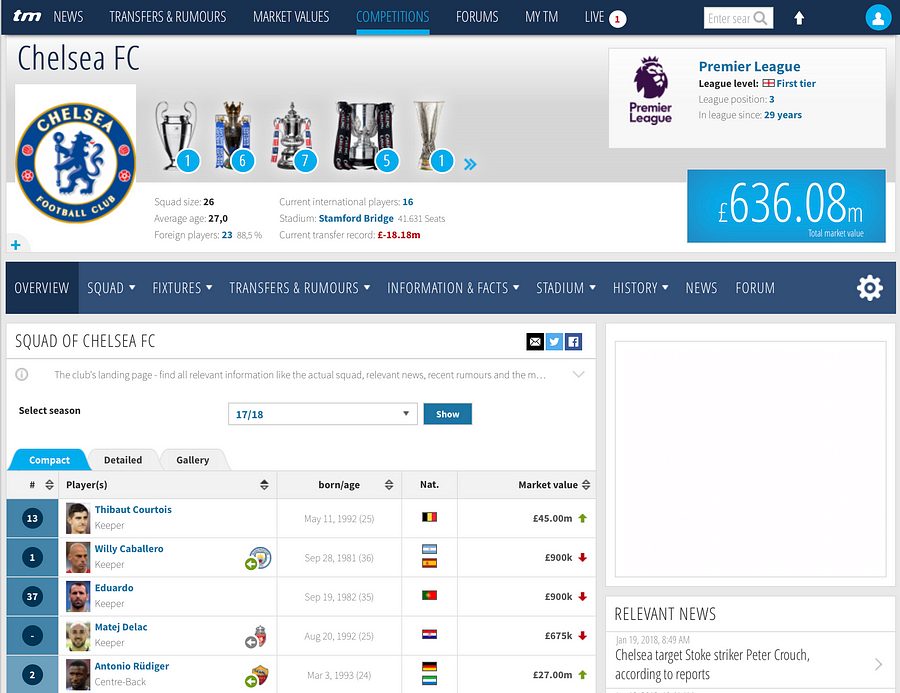
Transfermarkt is a German-based website owned by Axel Springer that has footballing information, such as scores, results, statistics, transfer news, and fixtures.
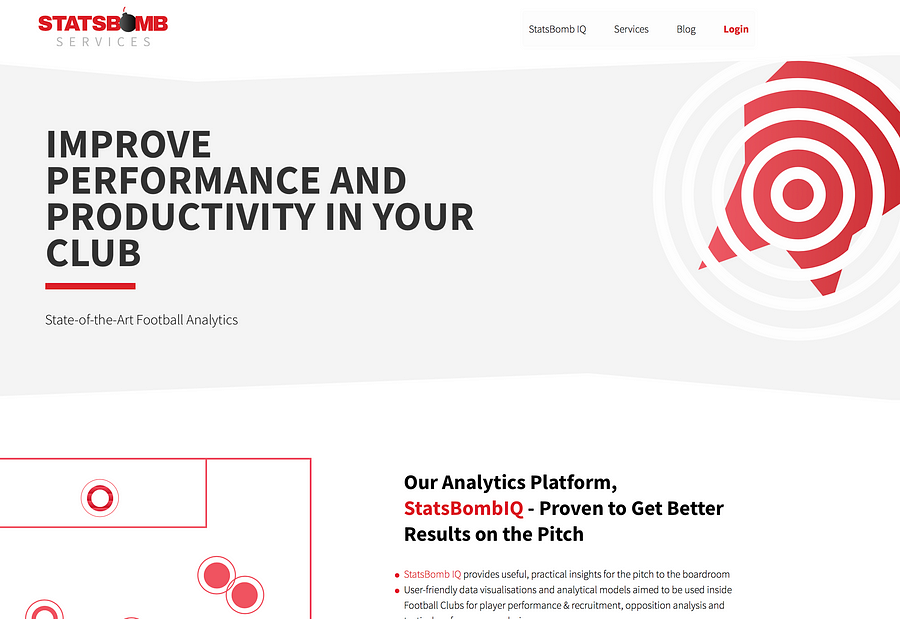
Many clubs are interested in incorporating statistics into their workflow, but few have the staff who know where to start. StatsBomb Services organises and parses all the data, delivers cutting edge visualisations and analysis, and is totally useful to journalists too.
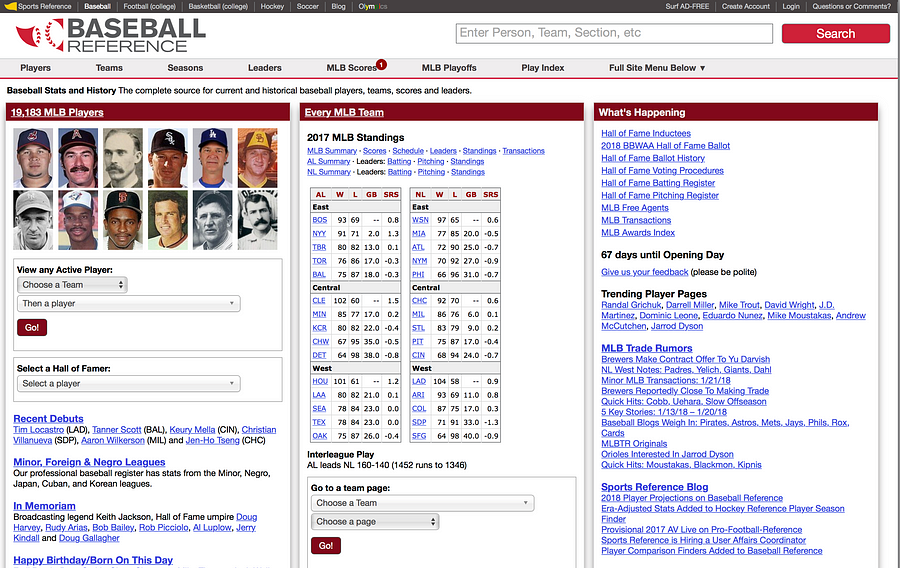
Sport-reference websites (US)
In the US, a good source of data are the various *-Reference.com sites, with the asterisk filled in with the name of the sport, like baseball and pro football (American style).
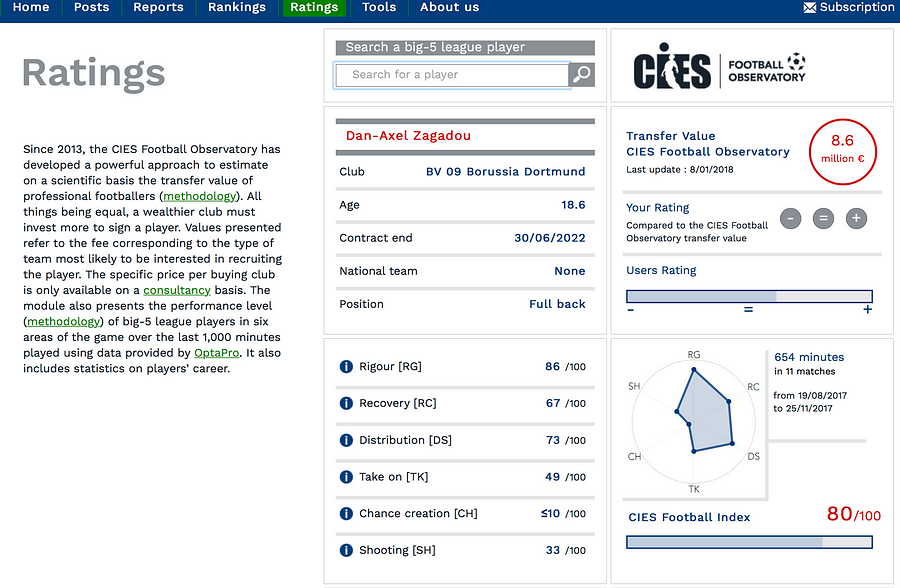
Since 2013, the CIES Football Observatory has developed a powerful approach to estimate the transfer value of professional footballers on a scientific basis.
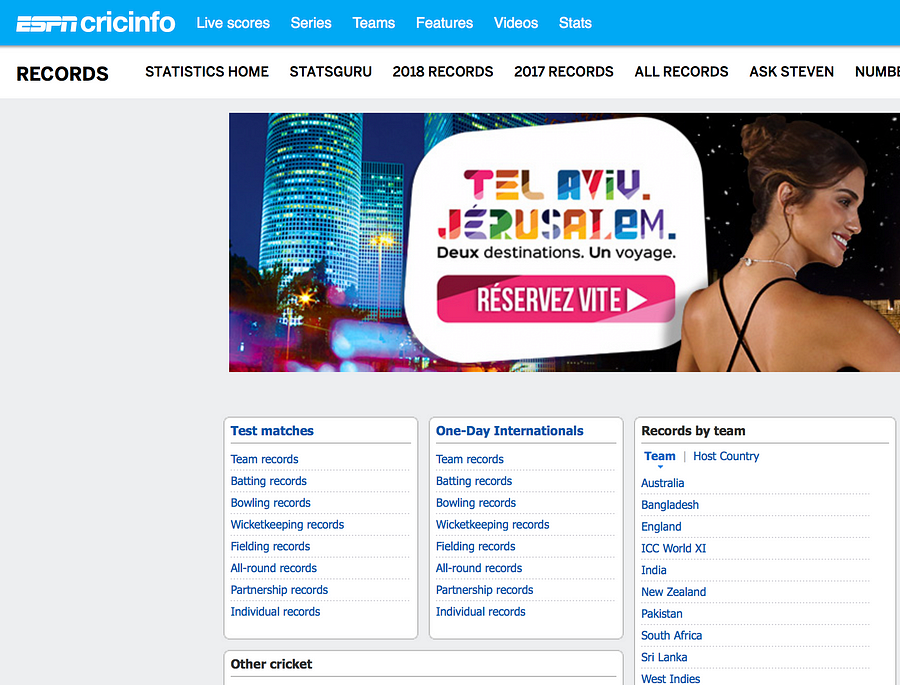
For cricket data, ESPN cricinfo is fantastic. It gathers very granular information on all matches and series from the past few years, ordered by country or by team.
Scroll down Wikipedia pages and they often have tables of data that you can grab.
Where do you find olympics data?
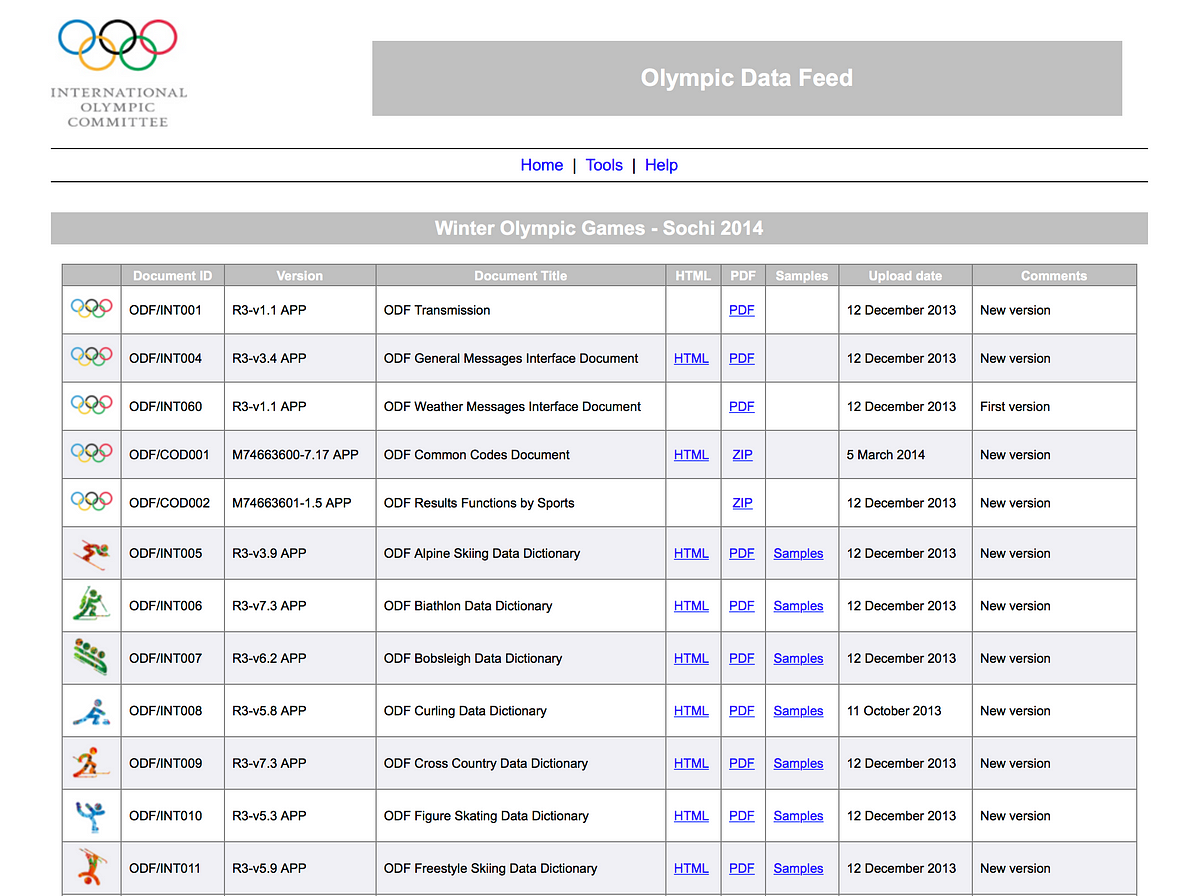
When it comes to the Olympic Games it is usually the Olympics Data Feed that has all the data:
The Olympic Data Feed is used by many news organisations worldwide
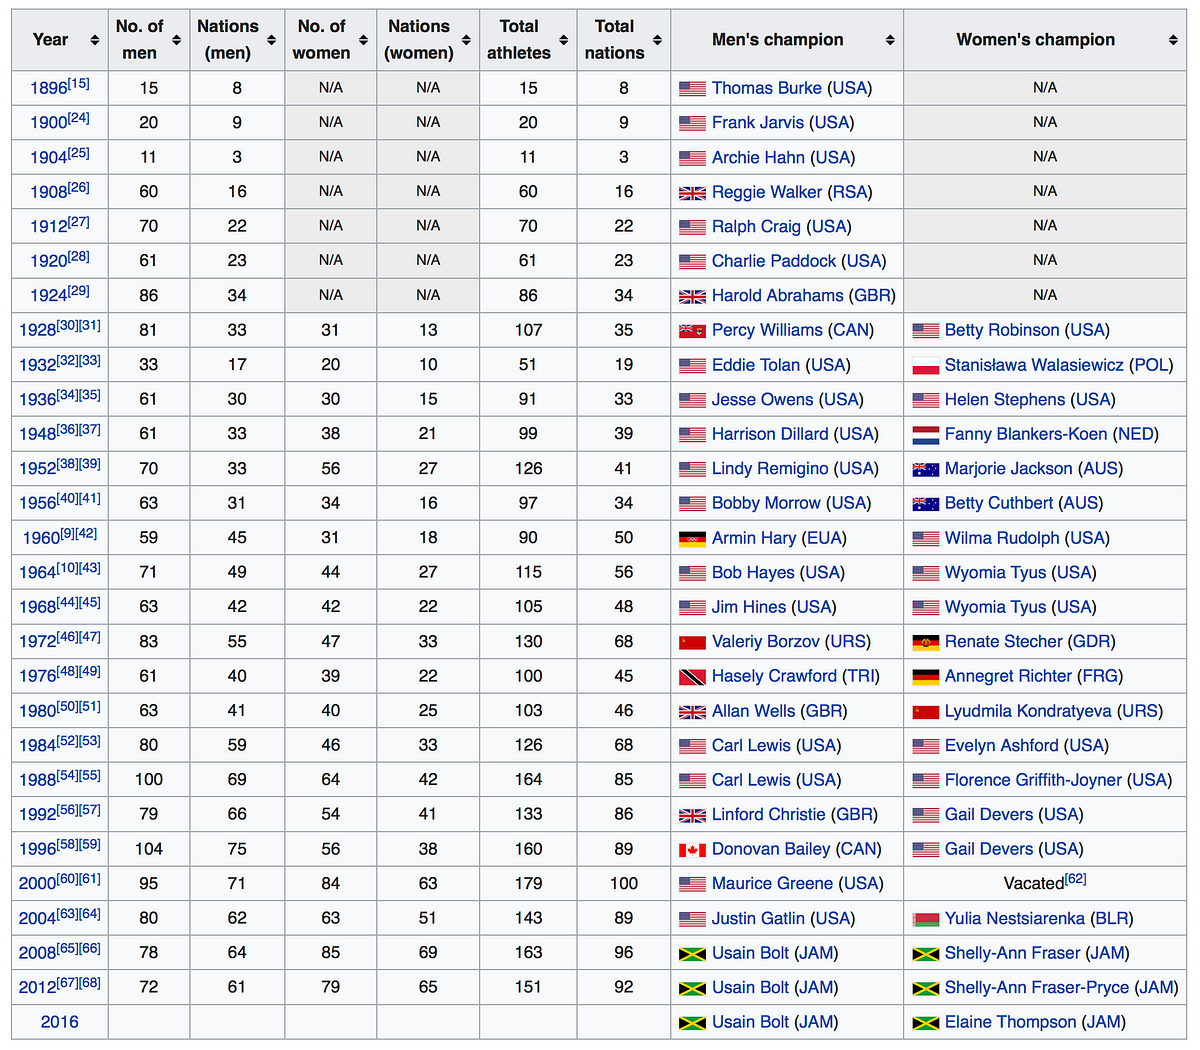
Alternatively, you can always look at Wikipedia, where a lot of data tables are available. For example, here is a table about the 100 metres at the Olympics:
Wikipedia offers a lot of historical data related to the olympics
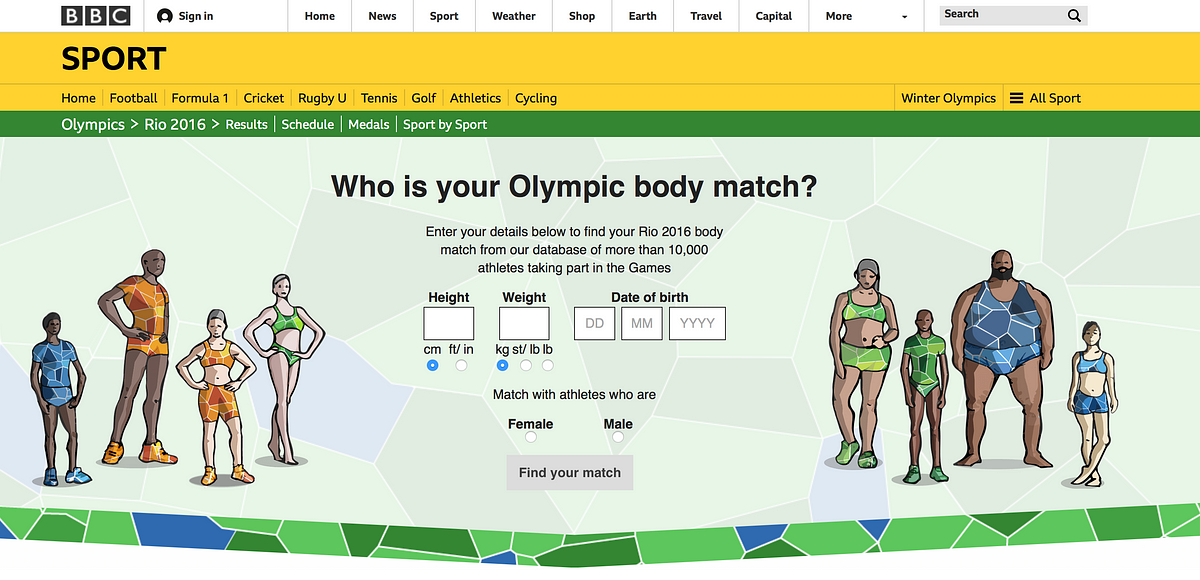
“What is fantastic with Olympic Games is the very different attributes of the athletes (age, height, weight) which you do not really get with other sports,” Nassos Stylianou from the BBC (UK).
Here is a project the BBC ended up doing for the Rio Olympics:
Over 10,500 athletes out of some 11,500 in the official Olympic Data Feed (ODF) have been used in this project.
Is verification a big issue in sports data?
“Verification is tricky, but not in the same way as data verification for other topics. It could be tricky when different data organisations or websites have different methodologies in their data collection,” Nassos Stylianou from the BBC (UK).
How do you choose which data to go after?
Nassos Stylianou: From our point of view, presenting data in a way that the audience understands is key. So wherever possible really, ‘industry standards’ are great, if they are meaningful and can provide interesting stories. But sometimes, it is the analysis of that data in a slightly different way that could provide a new and interesting angle. I don’t think that is different to any other type of data journalism really. Ask the right questions of your data, ask why certain things could be happening, try to visualise them in a way that answers all these questions.
Malcolm Coles: It depends what you’re trying to achieve. Are you looking to illuminate a specific event or match? Or trying to tell a story? Even for the latter, I think something like the project ‘One race, every medalist ever’ by The New York Times is doable with just Wikipedia data. But if you wanted to tell the story of how Bolt dominates, you would need split times for every 10m and you can’t get that from Wikipedia.
Interesting examples to look at
This project below, which is video-led, is a good example of where analysis of techniques worked really well with some data.
The “One-handed backhand project” by The New York Times
And this one, is an example where the Times newspaper worked with the Football Association to build a game for their audience to show how difficult or easy it is to referee (The Wall Street Journal did a similar one with being a tennis line judge). So working with analysts really does help.
What makes a good sports data story?
Steve Doig: Much of my career has been in investigative work, so I lean towards stories that investigate problems. A good example is the ‘Tennis Racket’ investigation by Buzzfeed’s John Templon and Heidi Blake.
The Tennis Racket investigation by BuzzFeed News
I also like fun stories, which can be created out of novel use of data. I’ve always argued that data journalism in general adds evidence to stories that otherwise would be collections of anecdotes. So sports data can do the same, I think. The data at least adds weight to the arguments being made about strategies or player choices, etc.
Nassos Stylianou: I don’t think this is different from any news story really –although it can be a lot more fun! So as with data journalism in general, a [good sports data story is a] story that tells you something new in a visually engaging way.
Malcolm Coles: A good sports data story is the same as any other good story really. I’ve tended to be more interested in how you can use data to visualise a story that you would otherwise tell in lots of complicated words.
Tips on visualising sports data
Nassos Stylianou: Always think of who your audience is. Many sports fans could be used to a certain type of visualisation that makes sense to them but makes no sense to other people. If you are aiming your story in their direction, you can work with that in mind but if you want this to go beyond the sport obsessive, that’s not always the best strategy.
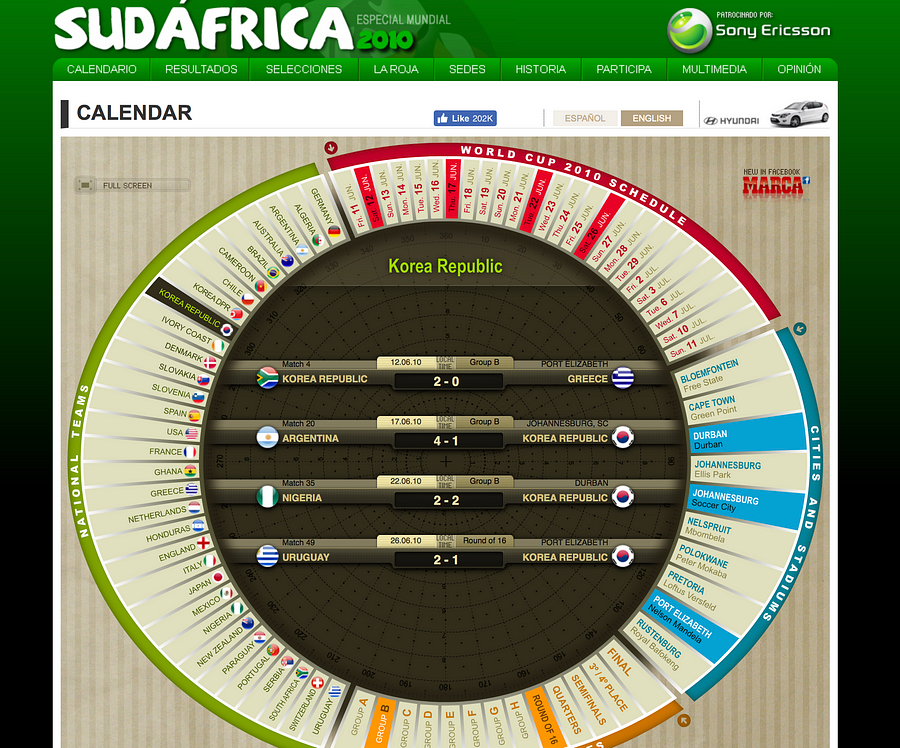
Malcolm Coles: I think a good visualisation is one that works on a mobile phone … I get shown this visualisation (pictured left) on the 2010 World Cup every year. It’s just fixtures data visualised — was great for its time. I get asked to build one like it every year, yet it won’t work on a mobile.
Steve Doig: Be aware of the growing number of sports analytics conferences being organized. The original, I believe, is the MIT Sloan Sports Analytics Conference held each year in Boston. About 1,800 young MBA students from all over the country (and now the world) show up trying to get hired as data analysts by sports leagues.
How do you get ready for big sports events like the Olympics, the Superbowl, or the Football World Cup?
Steve Doig: I’d say, do the same thing the on-air commentators do: gather all the relevant historical stats and be ready to use them in your stories. It’s also good to have stable of data analytics experts whose voices you can add to your stories.
Nassos Stylianou: Yep, prep well in advance. The great thing with these big events is also to build things that will work throughout the tournament.
Malcolm Coles: Try and build stuff outside of one off stories or investigations that you can reuse when the big tournament is over.
Over the past six years, the Global Editors Network has organised the Data Journalism Awards competition to celebrate and credit outstanding work in the field of data-driven journalism worldwide. To see the full list of winners, read about the categories, join the competition yourself, go to our website.
We got to talk to Mar Cabra, the former head of Data & Technology at the International Consortium of Investigative Journalists (ICIJ), about what makes a great cross-border collaboration. In this video, she shares with us some great tips for news teams around the world, big or small, who’d like to pump up their data investigation skills.
When collaborating, especially when it’s remote, includes data or goes across borders, you should think hard about what technology you’re going to use and what is the set of tools. Establish that from the beginning so that they are no complications later.
Most importantly, you need people that know how to collaborate and that are happy sharing. If not, your collaboration will fail.
Try to connect with people who have done collaborations before, do not re-invent the wheel.
Michaela Gruber is a journalism and media management student, based in Vienna, Austria. During her studies she spent a semester abroad in France, where she started working for HEI-DA.
As the company’s communication officer, she is in charge of the Data Journalism Blog and several social media activities. This year, Michaela was HEI-DA’s editor covering the Data Journalism Awards in Lisbon, Portugal.
Stephanie Sy of Thinking Machines (Philippines), Yolanda Ma of Data Journalism China and Esra Dogramaci of Deutsche Welle, formerly Al Jazeera (Germany), new members of the Data Journalism Awards jury, talk innovation, data journalism in Asia and the Middle East, and women in news.
left to right: Yolanda Ma (Data Journalism China), Esra Dogramaci (Deutsche Welle, formerly BBC and Al Jazeera), and Stephanie Sy (Thinking Machines) join DJA Jury
We welcomed three new members to the Data Journalism Awards jury last year (pictured above). They are all women, strong-willed and inspiring women, and they represent two regions that are often overlooked in the world of data journalism: Asia and the Middle East.
What was your first project in data journalism or interactive news and what memory do you keep from it?
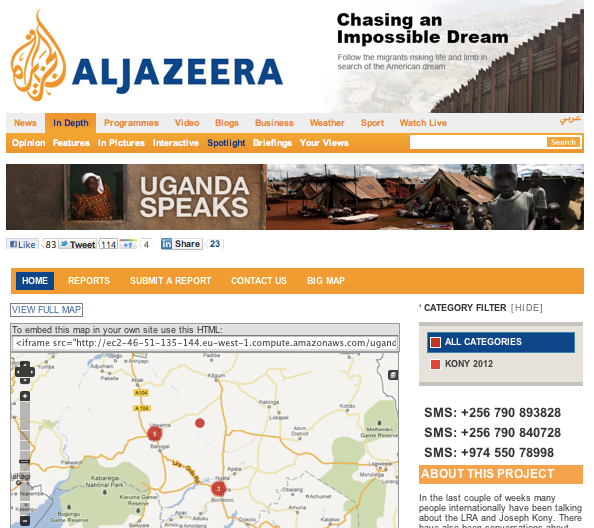
Esra Dogramaci: In 2012, Invisible Children launched a campaign to seek out Lord’s Resistance Army(LRA) leader Joseph Kony and highlight the exploitation of child soldiers. Then, at Al Jazeera, we wanted to see what people in North Uganda, who lived in one of the areas who were affected by the LRA actually had to say about it. They would ‘speak to tweet’ and we would map their reactions on Ushahidi using a Google Fusion table in the background.
Uganda Speaks by Al Jazeera
Although Al Jazeera had started doing this kind of projects back in 2009 during the war on Gaza (the experiment’s page of the Al Jazeera Lab website has now disappeared but can be viewed through WebArchive.org), it picked up steam during Egypt’s 2011 Arab Spring where, due to lack of broadcast media coverage, protesters were using social media to bring attention to what was happening.
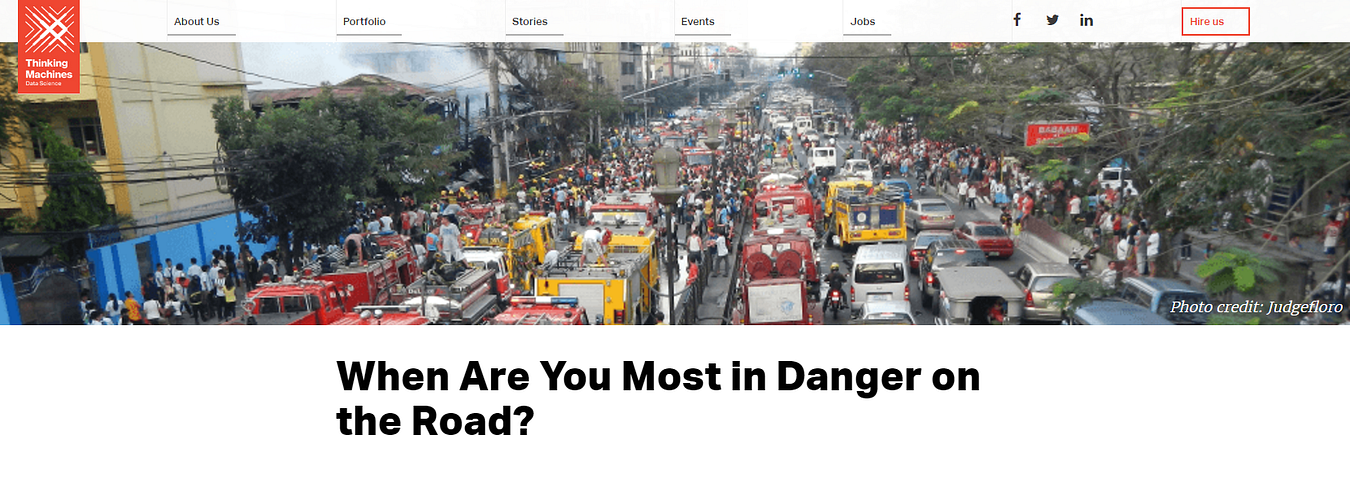
Interactive story by Thinking Machines
Stephanie Sy: Our first data journalism project as a team at Thinking Machines was a series of interactive stories on traffic accidents in Metro Manila. We cleaned and analysed a set of Excel sheets of 90,000 road accidents spanning 10 years.
It was the first project we worked on as a mixed team of journalists, designers, and data scientists, and the first time we tried to build something from scratch with d3.js! I worked on the d3 charts, and remember being in utter despair at how hard it was to get the interactive transitions to render nicely across different browser types. It was surprisingly well received by the local civic community, and that positive feedback emboldened us to keep working.
Connected China, Thomson Reuters
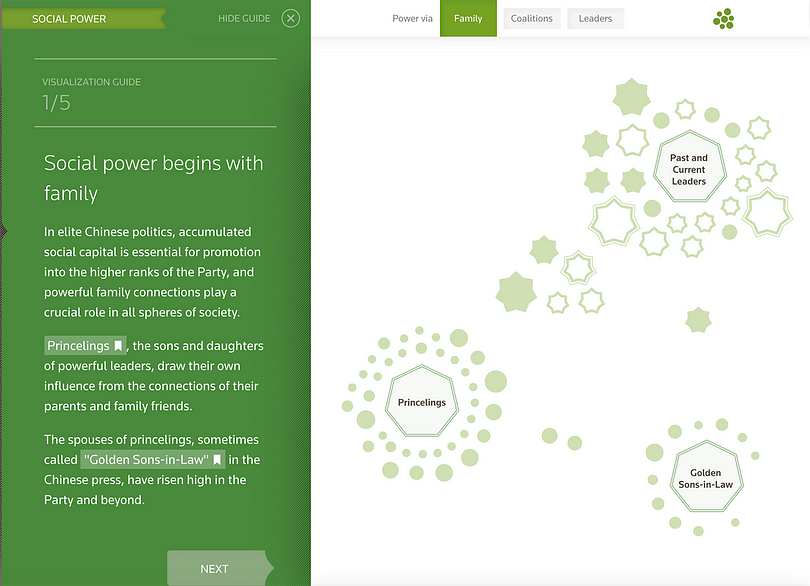
Yolanda Ma: One of my first projects was Connected China for Thomson Reuters, which tracked and visualised the people, institutions and relationships that form China’s elite power structure (learn more about it here).
This project taught me the importance of facts and every piece of data in it (thousands, if not millions in total) went through a rigid fact-checking process (by human beings, not machines, unfortunately). I learned by doing that facts are the bones of data journalism, not fancy visualisations, even though this project turned out to be fancy and cool, which is good too.
Now, what was the latest project you worked on and how do the two compare?
ED: Towards the end of last year, I taught a data journalism module to City University London Master’s students who were able to pull together their own data visualisation projects in the space of an hour. The biggest difference is how vastly the interfaces have improved and how quick and intuitive the designs and interactive softwares are now. There are a lot more companies switched on to storytelling beyond TV or text and that knowledge combined, how do you stand out in the world of online news?
Complementary to that Al Jazeera was always a front runner because they were willing to take risks and try something new when no one else was. In the newsrooms I’ve worked at or see since, there is still a general aversion to risk taking in preference of safety — though everyone knows that to survive and thrive in this digital media landscape, its risk taking, innovation that is going push those boundaries and really get you places.
SS: Our latest related data story is a piece we put together visualising traffic jams across Metro Manila during the holiday rush season. This time we were looking at gigabytes of Waze jams data that we accessed through the Waze API. It definitely grew out of our early work in transit data stories, but reflects a huge amount on growth in our ability to handle complex data, and understanding of what appeals to our audience.
One big piece of learning we got from this is that our audience in the Philippines mainly interacts with the news through mobile phones and via Facebook, so complex d3 interactives don’t work for them. What we do now is to build gifs on top of the interactives, which we then share on Facebook. You can see an example of that in the linked story. That gets us a tremendous amount of reach, as we’re able to communicate complex results in a format that’s friendly for our audience.
YM: I’ve been doing data journalism training mostly in the past few years and helping others do their data projects, so nothing comparable really. The latest project I worked on is this Data Journalism MOOC with HKU in partnership with Google News Lab. It is tailored-made for practitioners in Asia, and it’s re-starting again soon (begins March 6), so go on and register before it’s too late!
What excites you about the future of data journalism and interactive news?
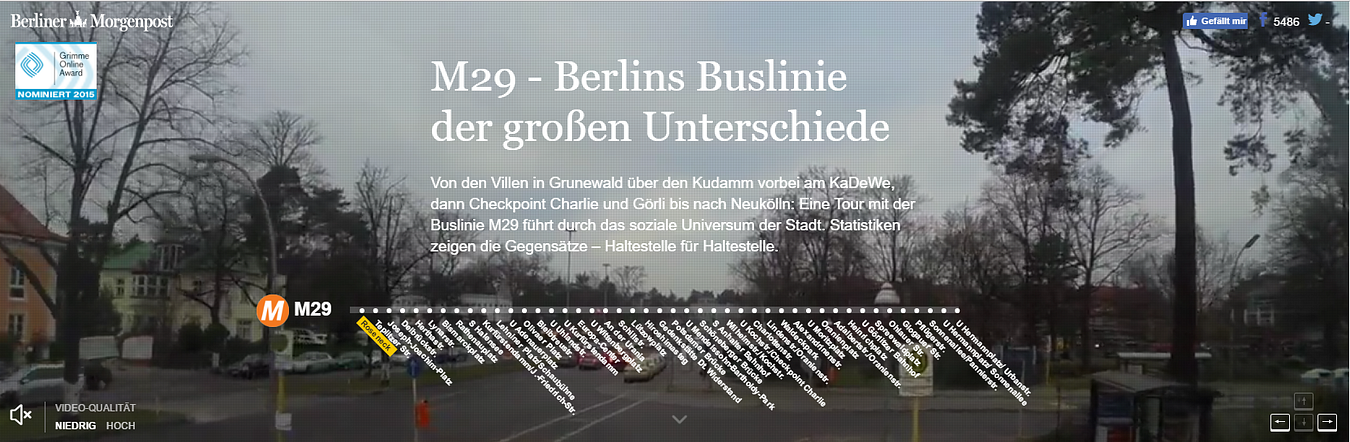
ED: The ability to tell stories in a cleaner, more engaging way. Literally everything can be turned into a story just by interrogating the data, being curious and asking questions. The digital news world has always been driven by data and it’s exciting to see how “traditional” journalism is embracing this more. I love this example from Berliner Morgenpost where they charted this bus line in Berlin, combined with a dash cam comparing various data such as demographics, voting. Its an ingenious way of taking complex data and breaking it into a meaningful, engaging way rather than pie charts.
M29 from Berliner Morgenpost
SS: There are tremendous amounts of data being generated in this digital age, and I think data journalism is a very natural evolution of the field. Investigative journalists should be able to use computer science skills to find their way through messy datasets and big data. It’s absolutely reasonable to expect that a news organization might get a 1 terabyte dump of files from a source.
YM: It excites me because it is the future. We live in the age of data, and the inevitable increasing amount of data available means there is growingly huge potential for data journalism. People’s news consumption is also changing and I believe personalisation is one of the key characteristics for the new generation of consumers, which means interactive news — interactive in many different ways — will thrive.
How are Asian and Middle Eastern media organisations (depending on your experience) doing in terms of data journalism and interactive news compared to the rest of the world?
ED: I think Al Jazeera has always been a pioneer in this. They have a great interactive team that drew together people from various disciplines within the organisation — coders, video people, designers, journalists — before everyone else was doing it and they’ve been able to shed light on stories that wouldn’t usually be picked up on by mainstream media radars.
SS: We have a few media organisations like the Philippine Center for Investigative Journalism, Rappler, and Inquirer who have been integrating data analysis into their reporting, but there isn’t anyone regularly producing complex data journalism pieces.
Our key problem is the lack of useful datasets. A huge amount of work goes into acquiring, cleaning, and triple checking the raw data. Analysis is “garbage in, garbage out” and we can’t create good data journalism without the presence of good data. This is where the European and North American media organisations have an edge. Their governments and civic society organisations follow open data standards, and citizens can request data [via FOIA]! The Philippine government has been making serious progress towards more open data sharing, and I hope they’re able to sustain that commitment.
Example that illustrates my point: PCIJ’s Money Politics project is a great example of an organisation doing the data janitorial work of acquiring and validating hard-to-find data. During our last presidential elections in 2015, GMA News Network and Rappler both created hugely popular election tracking live data stories.
PCIJ’s Money Politics
YM: Media organisations in Asia are catching up on data journalism and interactive news. There are some challenges of course, for example, lack of data in less developped countries, lack of skills and talents (and limited training opportunities), and even poor infrastructure or unstable internet especially in rural areas that would limit the presentation of news stories. Despite the difficulties, we do see good works emerging, though not necessarily in English. Check out some of the stories from the last GIJN’s Investigative Journalism Conference held in Nepal and you’ll get an idea.
Example that illustrates my point: This Caixin Media data story analysed and visualised the property market in China for the past few years.
Another New Normal, Caixin Media
What view do you have on the role of women in the world of news today? How is it being a woman in your respective work environment? Do you feel it makes a difference? If so, which one and why?
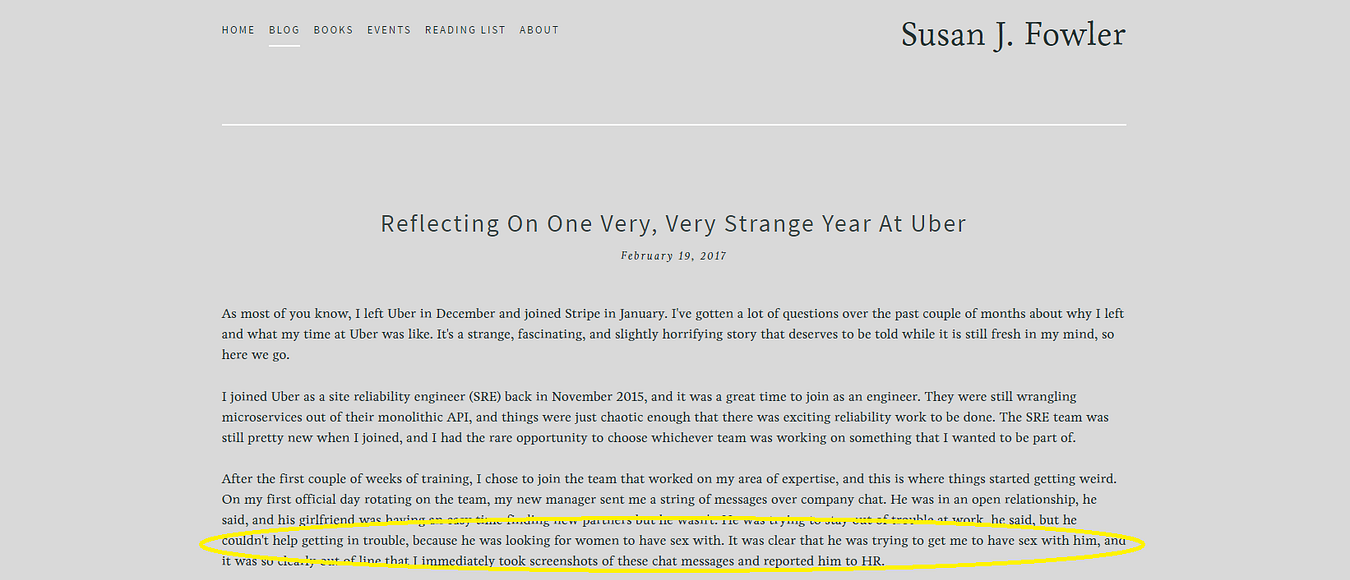
ED: Women are underrepresented not just in news coverage but in leadership positions too. I have to admit though that being at Deutsche Welle, I see a lot more women in senior management and it feels like a much more egalitarian working environment. However looking at my overall experience as a woman in news, you do face a lot of sexism and prejudice. Every woman I know has a story to tell and when the latest story about Uber came out a lot of my female colleagues around me were nodding their heads.
What got me through challenging times is having a fantastic network of female role models and mentors who are there to support you. That was one piece of advice I gave to prior teams, get a mentor. A lot of women feel isolated or feel the way they are treated is normal but it’s not. Women should also be aware that there is a real risk you will be punished if you speak up, challenge the status quo and tow the party line. If this happens, it’s an environment or team you probably shouldn’t be in anyway.
SS: It’s alarming to see parties around the world trying to stifle the voices of anyone who doesn’t belong and calling any news that doesn’t flatter them as “fake news.”. It’s important for us to speak up as women, and to practice intersectionality when it comes to other marginalised communities. As people who work with data, we can see past the aggregates and look at the complex messy truth. We must be able to communicate that complexity in order for our work to make a difference.
YM: Most of the data journalism teams in China are led by woman, and I think they are doing really well 🙂
What do you think makes a great data journalism project? What will you be looking for when marking projects for the Data Journalism Awards this year?
ED: Simplicity. It’s easy to get lost in data and try to do too much, but it’s often about taking something complex and making it accessible for a wider audience, getting them to think about something they haven’t or perhaps consider in a different way. I’ll be looking for the why — why does this matter, does this story or project make a dent in the universe?
After all, isn’t that what telling stories is about? The obvious thing that comes through is passion. It’s also something obvious but you can tell when a person or team has cared and really invested into the work versus projects being rolled off a conveyor belt.
SS:A great data journalism project involves three things: novel data, clever analytical methods, and great communication through the project’s medium of choice. I’m hoping to see a wide variety of mediums this year!
Will someone be submitting an audio data journalism project? With all the very exciting advances in the field of artificial intelligence this year, I’m also hoping to see projects that incorporate machine learning, and artificial intelligence.
YM: I believe data journalism is after all journalism — it has to reveal truth and tell stories, based or driven by data. I’ll be looking for stories that do make an impact in one way or another.
If you had one piece of advice for people applying for the Data Journalism Awards competition, what would it be?
ED: Don’t be intimidated by the competition or past award winners. Focus on what you do best. I say this especially for those applying for the first time, I see a lot of hesitation and negative self talk of ‘I’m not good enough’ etc. In every experience there’s something to learn, so don’t hesitate.
SS: Don’t forget to tell a story! With data science methods, it’s easy to get lost in fancy math and lose track of the narrative.
YM: Tell us a bit about the story behind your story — say, we may not know how hard it might be to get certain data in your country.
What was the best piece of advice you were ever given in your years of experience in the media industry?
ED: Take every opportunity. That’s related to a quote that has been coming up over and over again for the past week or so, “success is when preparation meets opportunity.”
SS: One of my best former bosses told me to imagine that a hungover, unhappy man with a million meetings that day was the only reader of my work. He haunts me to this day.
YM: I started my career with the ambition (like many idealistic young people) to change China. My first (and second) boss Reg Chua once said to me, don’t worry about changing China but focus on making small changes and work with a long-term vision. Sounds cliche.
He said that to me in 2012. The next year, together with two other friends I started DJChina.org, which started in 2013 as a small blog and now grown to be one of the best educational platforms for data journalism practitioners in China. The year after, in 2014, Open Data China was launched (using the domain name I registered a few years back), and indicated a bottom-up movement to push for more open data, which was incorporated into national policy within a year. So I guess all these proved that Reg was right, and it could be applied to anywhere, or anything. Think big, act small, one story (or project) at a time, and changes will happen.
left to right: Yolanda Ma (Data Journalism China), Esra Dogramaci (Deutsche Welle, formerly BBC and Al Jazeera), and Stephanie Sy (Thinking Machines)
Stephanie Sy is the founder of Thinking Machines, a data science and data engineering team based in the Philippines. She brings to the jury her expertise in data science, engineering and storytelling.
Yolanda Ma is the co-founder of Data Journalism China, one of the best educational platforms for data journalism practitioners in China. Not only representing the biggest country in Asia, she also has experience teaching data skills to journalists and a great knowledge of data journalism from her region.
Esra Dogramaci has now joined Deutsche Welle and formerly worked with the BBC, Al Jazeera in Qatar and Turkey, as well as the UN Headquarters and UNICEF. She brings to the DJA jury significant experience in digital transformation across news and current affairs, particularly in social video and off platform growth and development.
Marianne Bouchart is the founder and director of HEI-DA, a nonprofit organisation promoting news innovation, the future of data journalism and open data. She runs data journalism programmes in various regions around the world as well as HEI-DA’s Sensor Journalism Toolkit project and manages the Data Journalism Awards competition.
Before launching HEI-DA, Marianne spent 10 years in London where she worked as a web producer, data journalism and graphics editor for Bloomberg News, amongst others. She created the Data Journalism Blog in 2011 and gives lectures at journalism schools, in the UK and in France.
Tools like Tableau make it really easy to make exploratory visualisations, giving the user the ability to sift through the data and localise it to themselves. However, as tempting as this can be, the role of the data journalist it to tell the reader what the data means — if you have a dataset that includes the entire country but only a handful of locations are relevant to your story, an exploratory map isn’t the best approach. Aim for explanatory visualisations.
2. Simple is usually better
A quick glance through the examples page of d3js.org reveals a wealth of different and unusual ways to visualise data. While there are definitely occasions where an exotic visualisation method communicates the data more effectively than a simple line or pie chart, these are really rather rare. The Economist’s use of series charts to efficiently summarise an entire article in a tiny space demonstrates how effective the “classic” visualisation types are — there’s a reason they’ve stood the test of time (The Economist’s incredibly clear descriptions and simple writing style also really help here). Meanwhile, I don’t think I’ve ever gained any insights from a streamgraph, pretty as they are.
3. Code for quality
News moves really quickly, which can make it exceptionally difficult to code for quality over speed. Nevertheless, all aspects of your data visualisation need to work — a bug causing a minor element like a tooltip to not update or report the wrong data can at best reduce reader confidence, or at worst, taint a long and costly investigation, possibly even leading to libel proceedings. This is made all the more difficult by the fact that JavaScript is what’s referred to as a “weakly typed” language, meaning that variable types (strings, numbers, objects, et cetera) can mutate over the course of a script’s execution without throwing errors — for instance, `Number(a + b)` will either return the sum of `a` and `b` or the concatenated value of those two variables (e.g., `’1’ + ‘2’ = ‘12’`), depending on whether they’re strings or numbers to begin with. This can be incredibly difficult to discover and troubleshoot. Fortunately, projects like Flow and TypeScript seek to add type annotations to JavaScript, effectively solving this problem (My recent open source project, generator-strong-d3, makes it really easy to scaffold a D3 project using either of these). Another way to improve code quality is to provide automated tests, which are a bit more work at the outset but will prevent bugs from cropping up as you get frantic towards deadline. “Test-Driven Development” (TDD) is a good practise to get into as it encourages you to write tests at the very beginning and then develop until those pass. It’s also a lot faster than writing tests later (or not at all, i.e., “cowboy coding”) once you get the hang of it, as you can save a lot of time avoiding the “make a change, refresh, manually execute a behaviour, evaluate output, repeat” cycle.
Ændrew Rininsland is a senior newsroom developer at The Times and Sunday Times and all-around data visualisation enthusiast. In addition to Axis, he’s the lead developer for Doctop.js, generator-strong-d3, Github.js and a ludicrous number of other projects. His work has also been featured by The Guardian, The Economist and the Hackney Citizen, and he recently contributed a chapter to Data Journalism: Mapping the Future?, edited by John Mair and Damian Radcliffe and published by Abramis. Follow him on Twitter and GitHub at @aendrew.


 Michaela Gruber is a journalism and media management student, based in Vienna, Austria. During her studies she spent a semester abroad in France, where she started working for HEI-DA.