The Winter Olympics 2018 in PyeongChang, South Korea, are just a few weeks away, and the football world cup 2018 is not far off either. While many journalists around the world are preparing their coverage, we wonder: how do you get ready for these big sporting events? What’s the difference between a sports data journalism project and any other data project? Where do you find data and analytics on this topic?
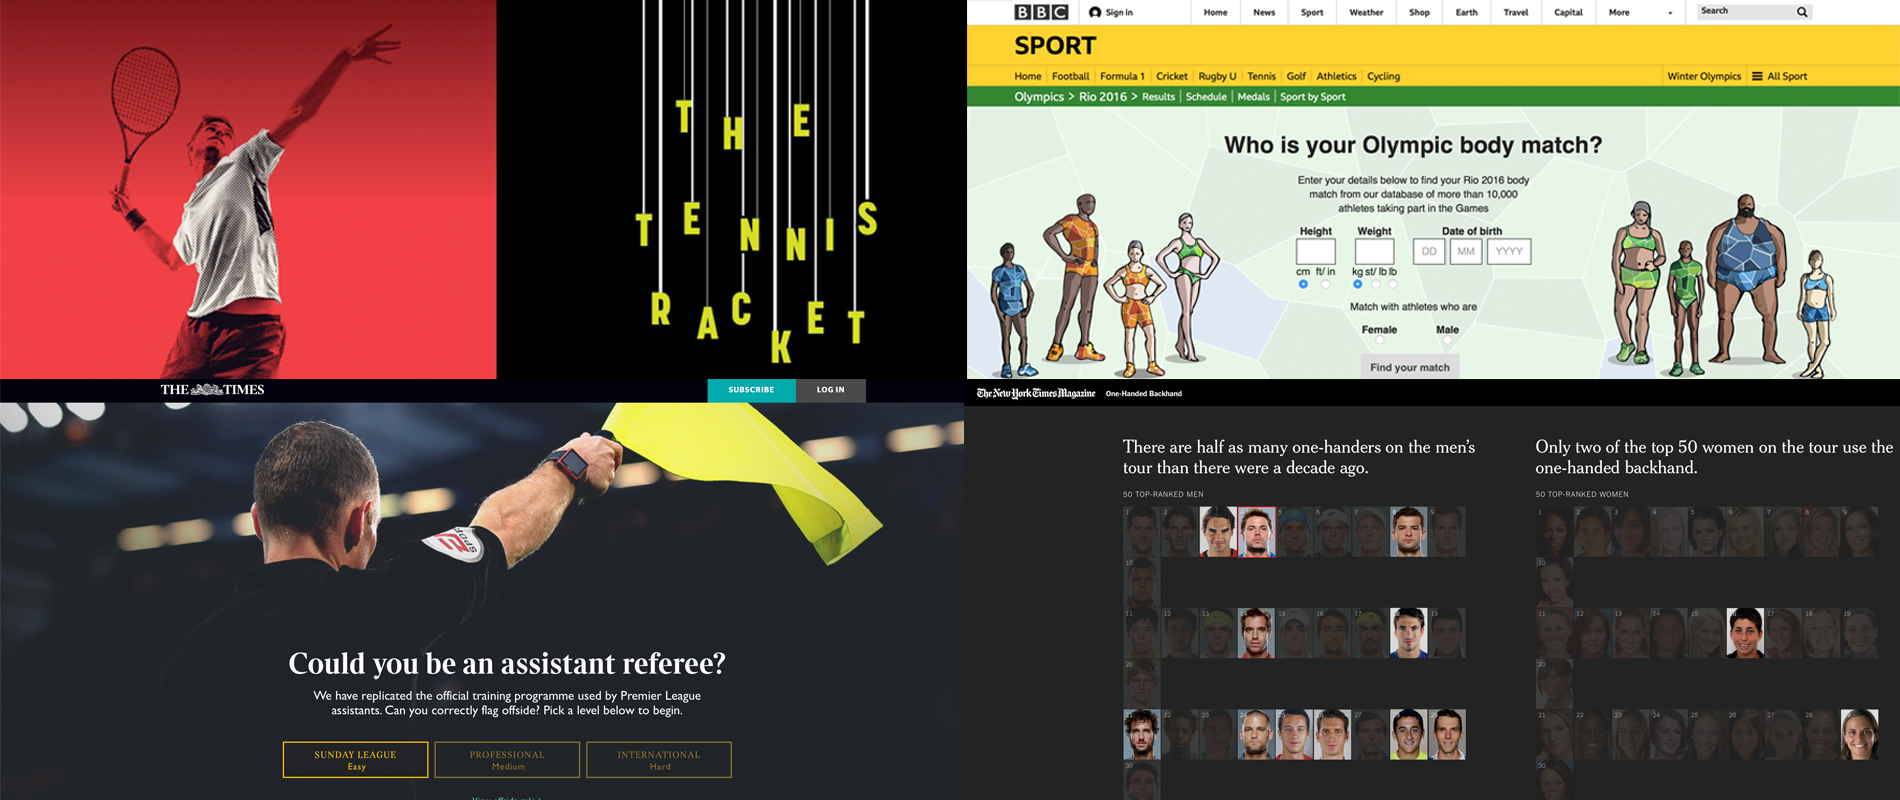
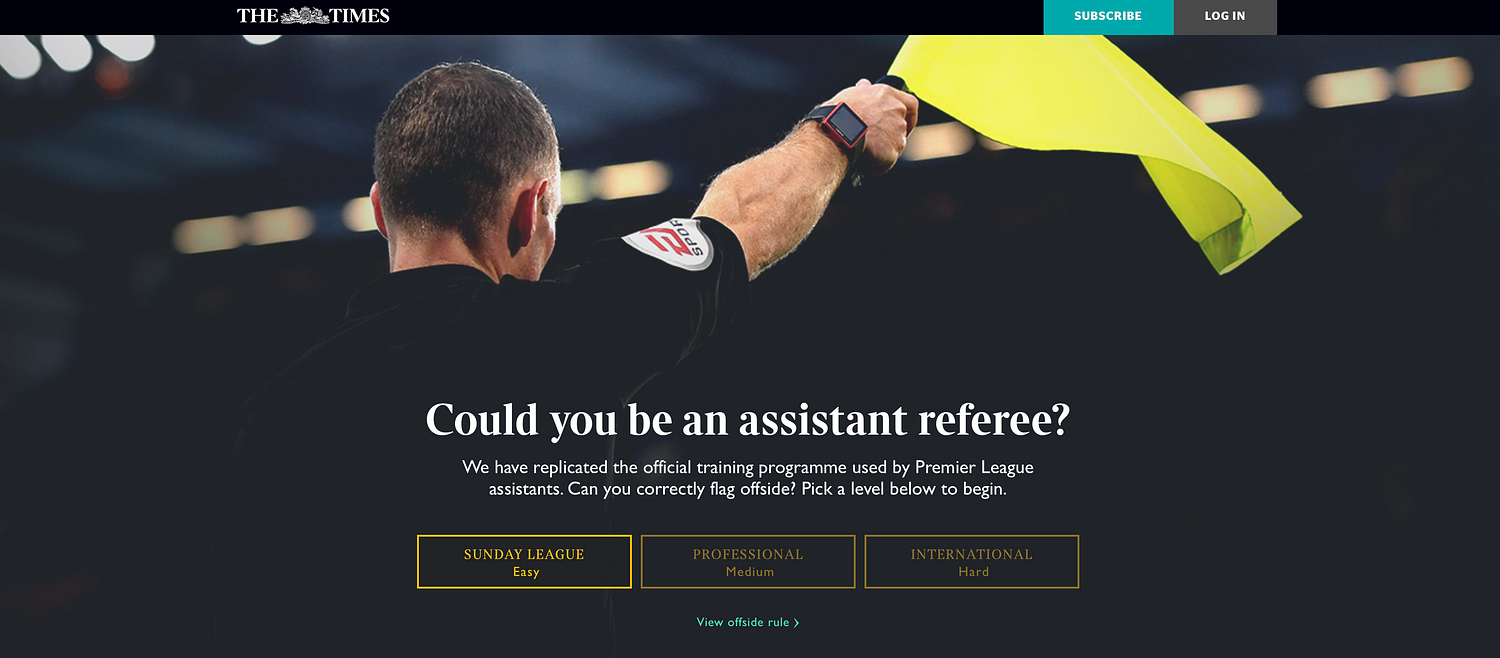
From top left, clockwise: ‘The Tennis Racket’ project by BuzzFeed News, ‘Who is your Olympic body match?’ by the BBC, the ‘One-handed backhand’ project by The New York Times, and ‘Could you be an assistant referee?’ by The Times.
We’ve gathered four experts from both sides of the pond to answer these questions and share tips on how to best work with sports data in the newsroom.
Steve Doig from ASU’s Cronkite School of Journalism (US), Paula Lavigne from ESPN (US), Nassos Stylianou from the BBC (UK), and Malcolm Coles, digital publishing strategy consultant, formerly with the Telegraph and the Trinity Mirror (UK), all joined the conversation. Here is a compilation of what we’ve learned.
The main differences between sports data and other types of data
All our experts agreed that working with sports data is a little different from working with any other types of data.
Here are the four main differences they pointed out during our discussion:
- You don’t have to have a public records fight to get it
- The problem with sports data is that there’s such a flood of it that people are still trying to find ways to get good signal out of all the noise
- The data is often very granular (up-to-the-minute data, or even up-to-the-second data, is quite common)
- Fans have a huge interest in it
“Sports is the one part of a news organisation where the consumers really care about numbers. It’s a lot harder to sell a data story in other news contexts,” Steve Doig (ASU’s Cronkite School of Journalism, US).
The fastest 100m times ever. Those caught doping struck out in red.
As the example above shows, there’s a whole data ecosystem of what you can call the ‘obsessed fans’, some of whom ‘have gone on to create viable business models of gathering and adding value to the raw data’, Doig argued.
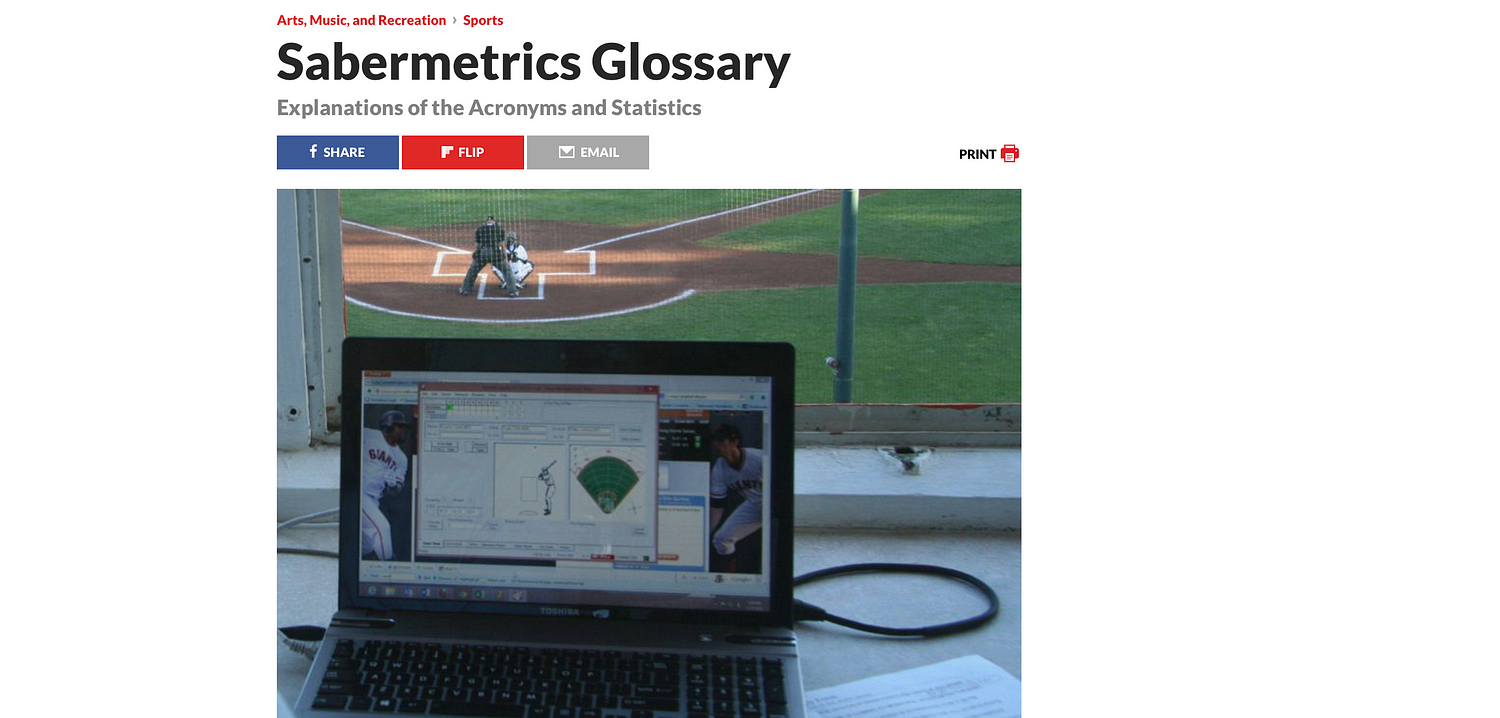
Steve Doig shared with us this glossary of some “moneyball” metrics that have been created, often by fans rather than the pros themselves
Where do you find sports data?
“In the US, certainly, the major pro sports leagues have opened up their data streams to just about anyone…and much of it can be played with using simple computer tools like Excel,” Steve Doig (ASU’s Cronkite School of Journalism, US).
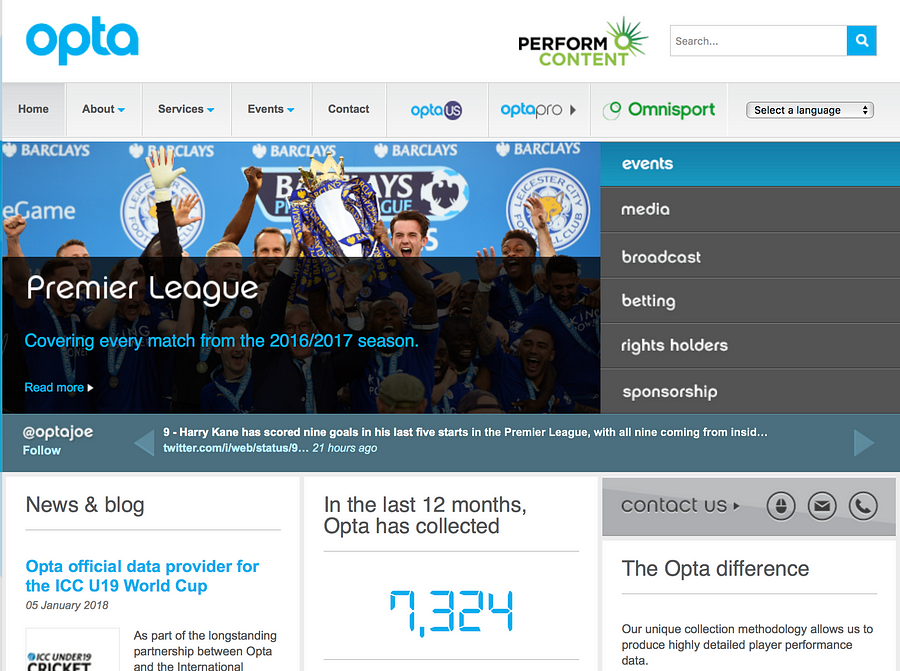
Opta
Opta is the world’s leading live, detailed sports data provider. A lot of their stats are proprietary, but a lot of news organisations in the world have agreements with them.
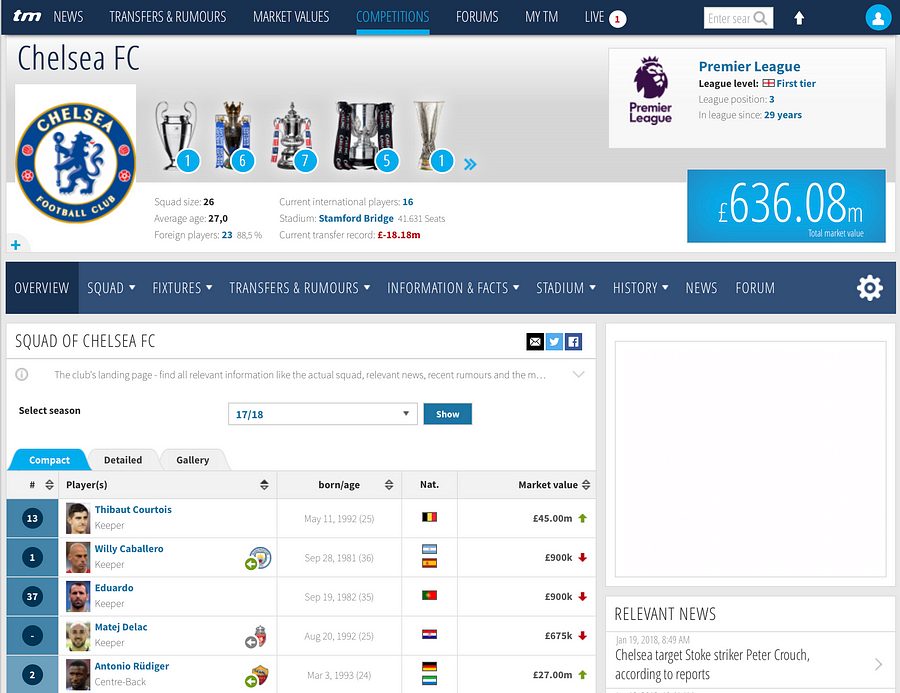
Transfermarkt
Transfermarkt is a German-based website owned by Axel Springer that has footballing information, such as scores, results, statistics, transfer news, and fixtures.
WhoScored
WhoScored brings you live scores, match results and player ratings from the top football leagues and competitions.
Statsbomb Services
Many clubs are interested in incorporating statistics into their workflow, but few have the staff who know where to start. StatsBomb Services organises and parses all the data, delivers cutting edge visualisations and analysis, and is totally useful to journalists too.
Sport-reference websites (US)
In the US, a good source of data are the various *-Reference.com sites, with the asterisk filled in with the name of the sport, like baseball and pro football (American style).
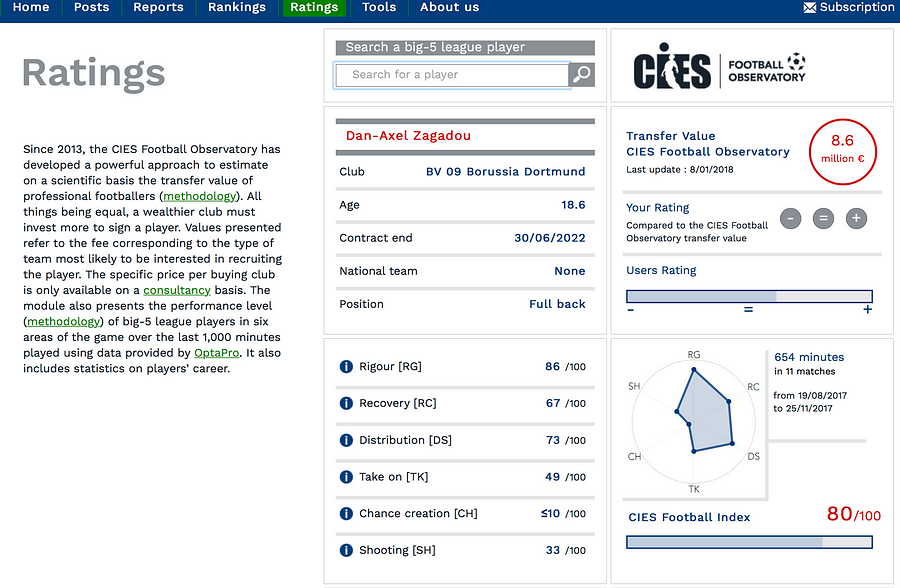
CIES Football Observatory
Since 2013, the CIES Football Observatory has developed a powerful approach to estimate the transfer value of professional footballers on a scientific basis.
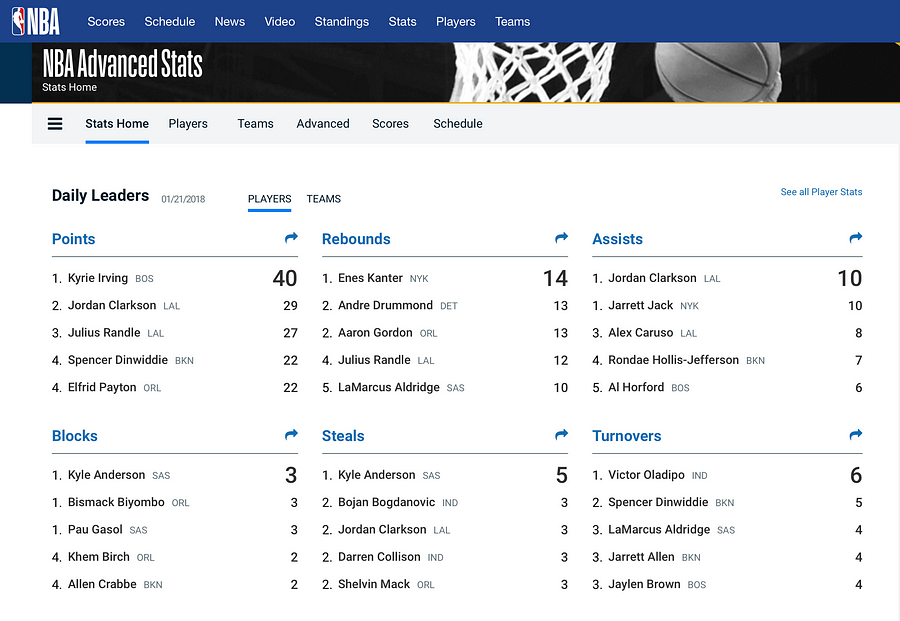
NBA Stats
The leagues themselves, such as the NBA, supply data on players, teams, scores, lineups, and more.
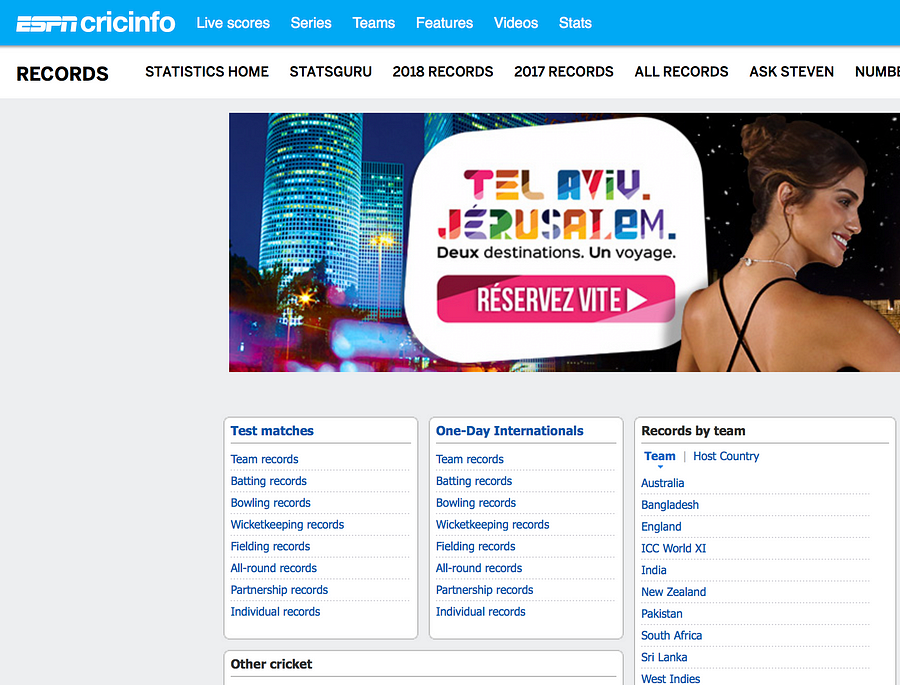
ESPN Cricinfo
For cricket data, ESPN cricinfo is fantastic. It gathers very granular information on all matches and series from the past few years, ordered by country or by team.
Where do you find olympics data?
When it comes to the Olympic Games it is usually the Olympics Data Feed that has all the data:
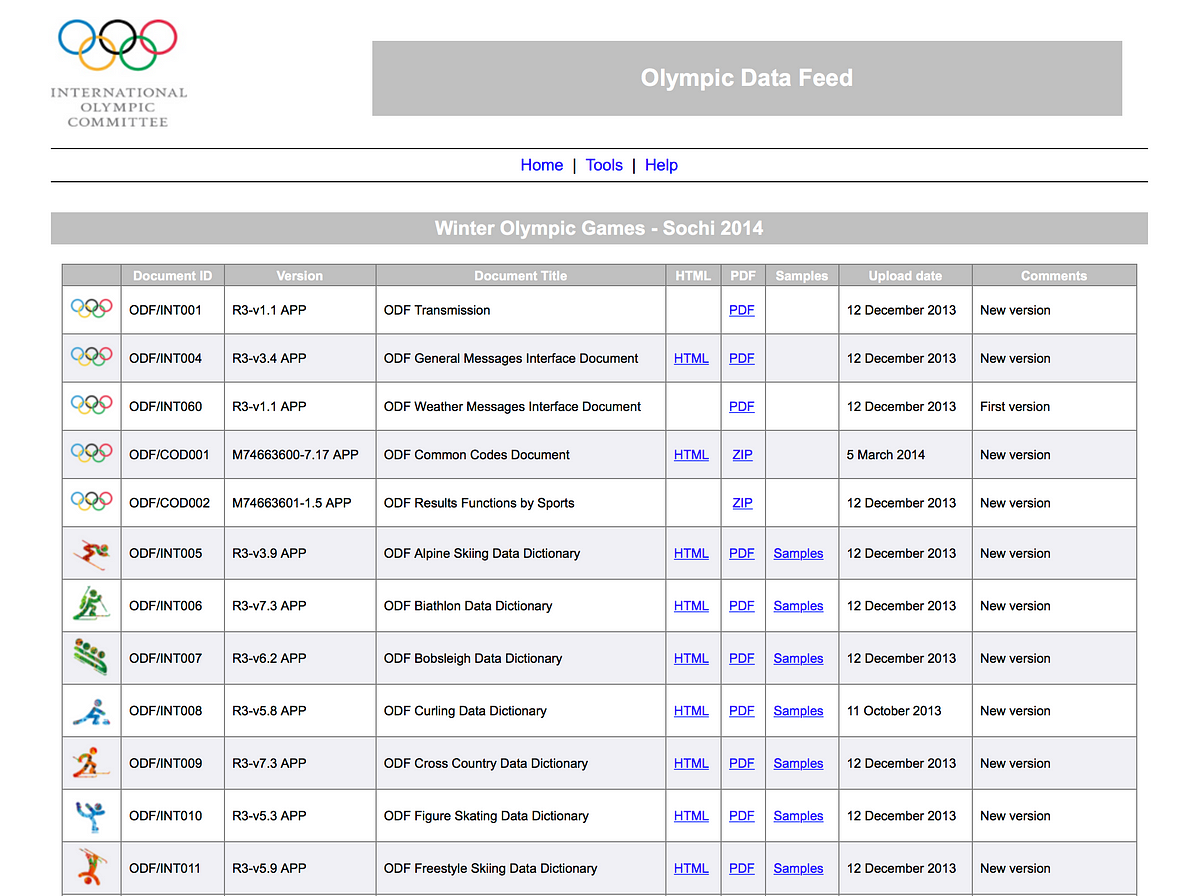
The Olympic Data Feed is used by many news organisations worldwide
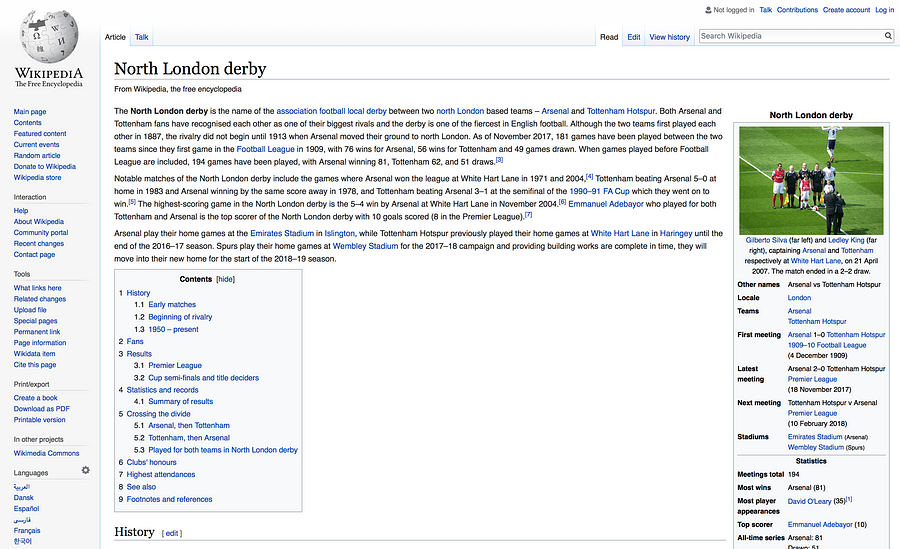
Alternatively, you can always look at Wikipedia, where a lot of data tables are available. For example, here is a table about the 100 metres at the Olympics:
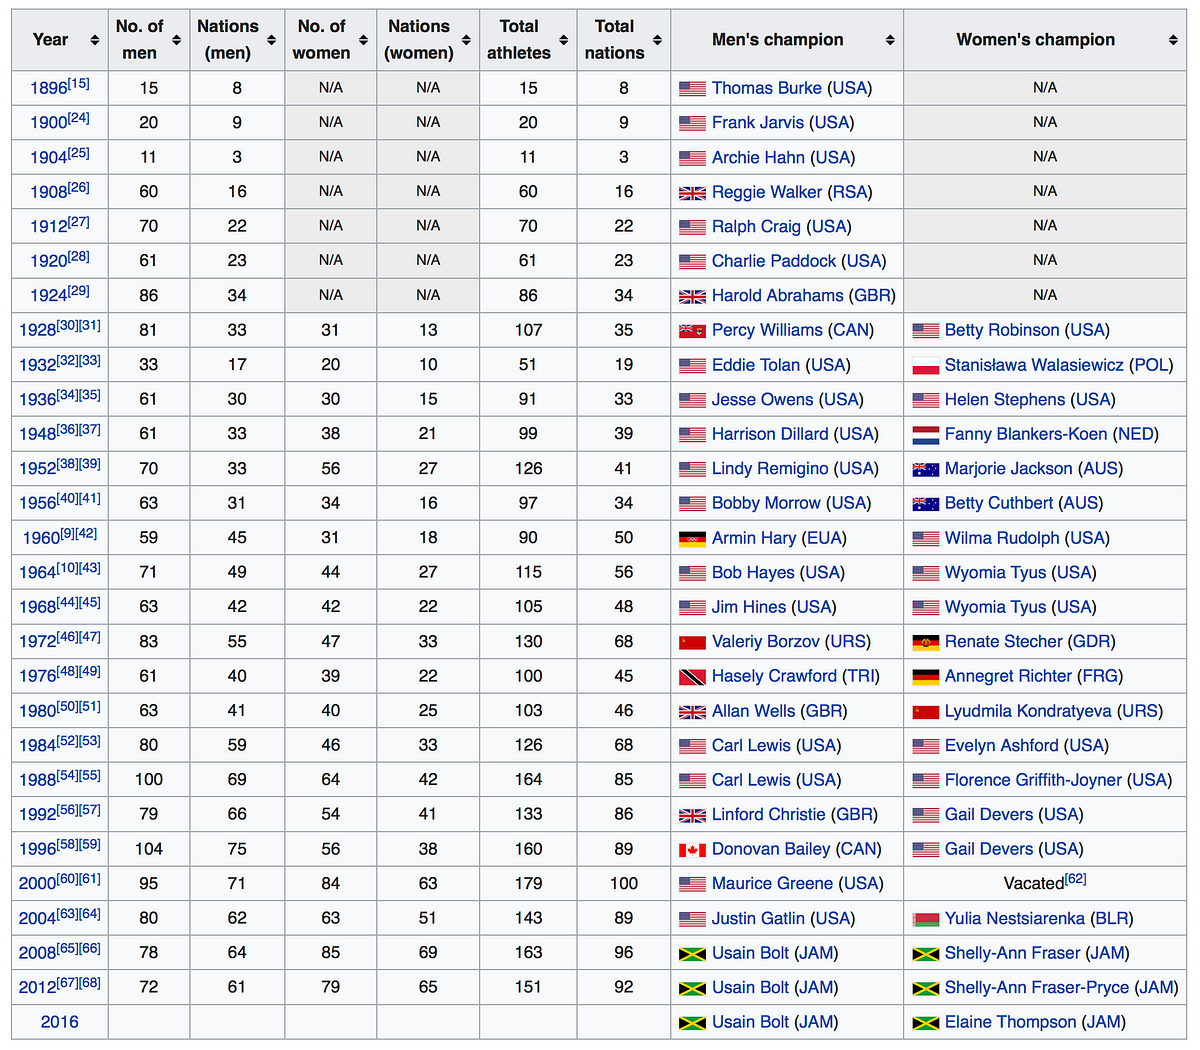
Wikipedia offers a lot of historical data related to the olympics
“What is fantastic with Olympic Games is the very different attributes of the athletes (age, height, weight) which you do not really get with other sports,” Nassos Stylianou from the BBC (UK).
Here is a project the BBC ended up doing for the Rio Olympics:
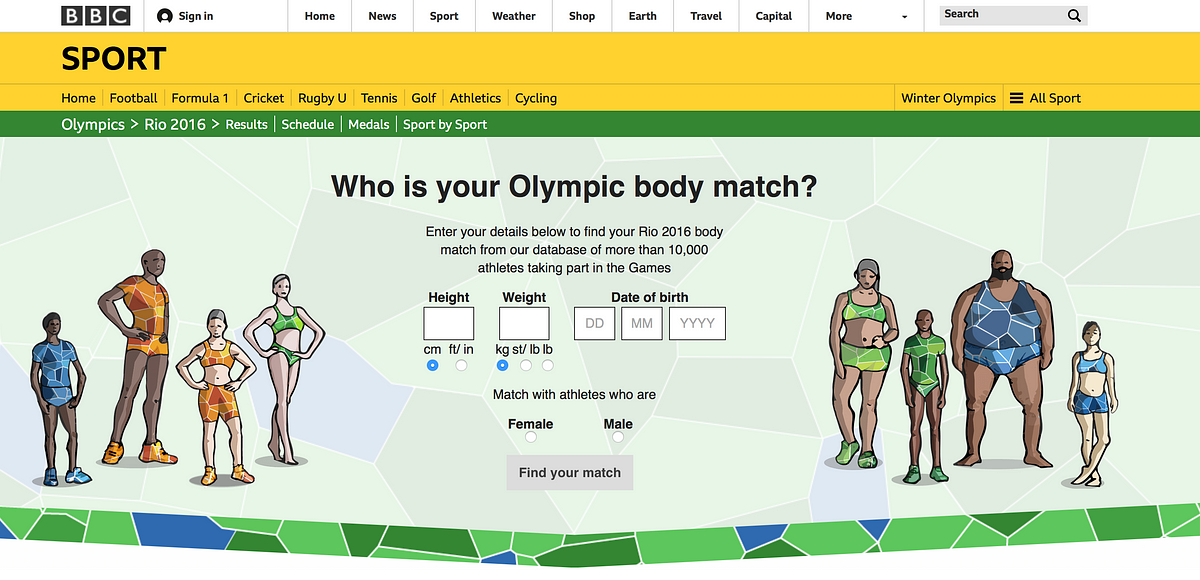
Over 10,500 athletes out of some 11,500 in the official Olympic Data Feed (ODF) have been used in this project.
Is verification a big issue in sports data?
“Verification is tricky, but not in the same way as data verification for other topics. It could be tricky when different data organisations or websites have different methodologies in their data collection,” Nassos Stylianou from the BBC (UK).
How do you choose which data to go after?
Nassos Stylianou: From our point of view, presenting data in a way that the audience understands is key. So wherever possible really, ‘industry standards’ are great, if they are meaningful and can provide interesting stories. But sometimes, it is the analysis of that data in a slightly different way that could provide a new and interesting angle. I don’t think that is different to any other type of data journalism really. Ask the right questions of your data, ask why certain things could be happening, try to visualise them in a way that answers all these questions.
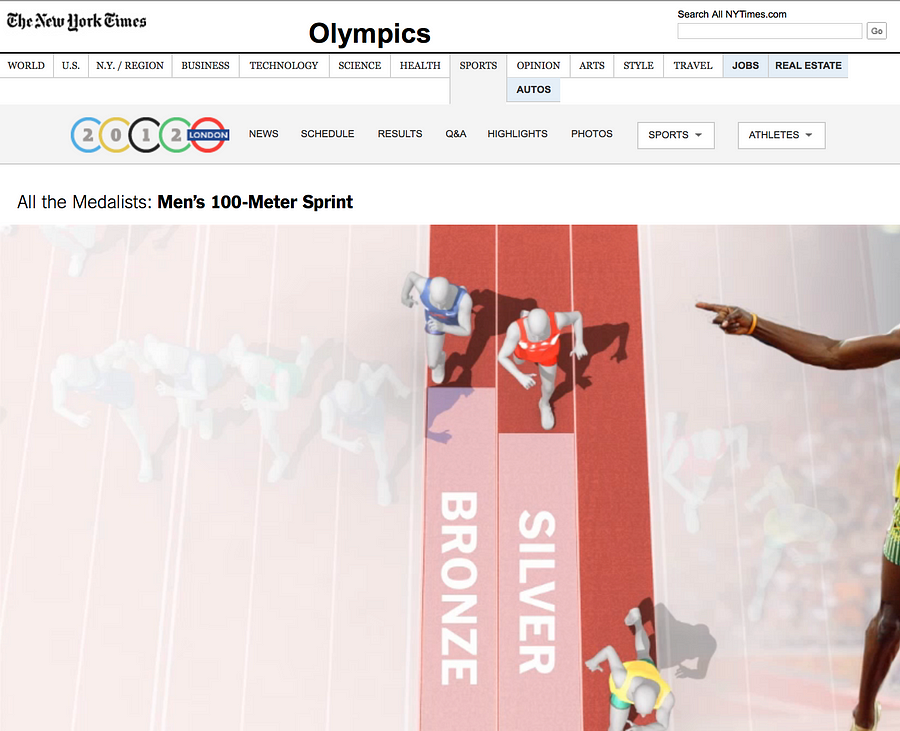
The “One race, every medalist ever” project by The New York Times
Malcolm Coles: It depends what you’re trying to achieve. Are you looking to illuminate a specific event or match? Or trying to tell a story? Even for the latter, I think something like the project ‘One race, every medalist ever’ by The New York Times is doable with just Wikipedia data. But if you wanted to tell the story of how Bolt dominates, you would need split times for every 10m and you can’t get that from Wikipedia.
Interesting examples to look at
This project below, which is video-led, is a good example of where analysis of techniques worked really well with some data.
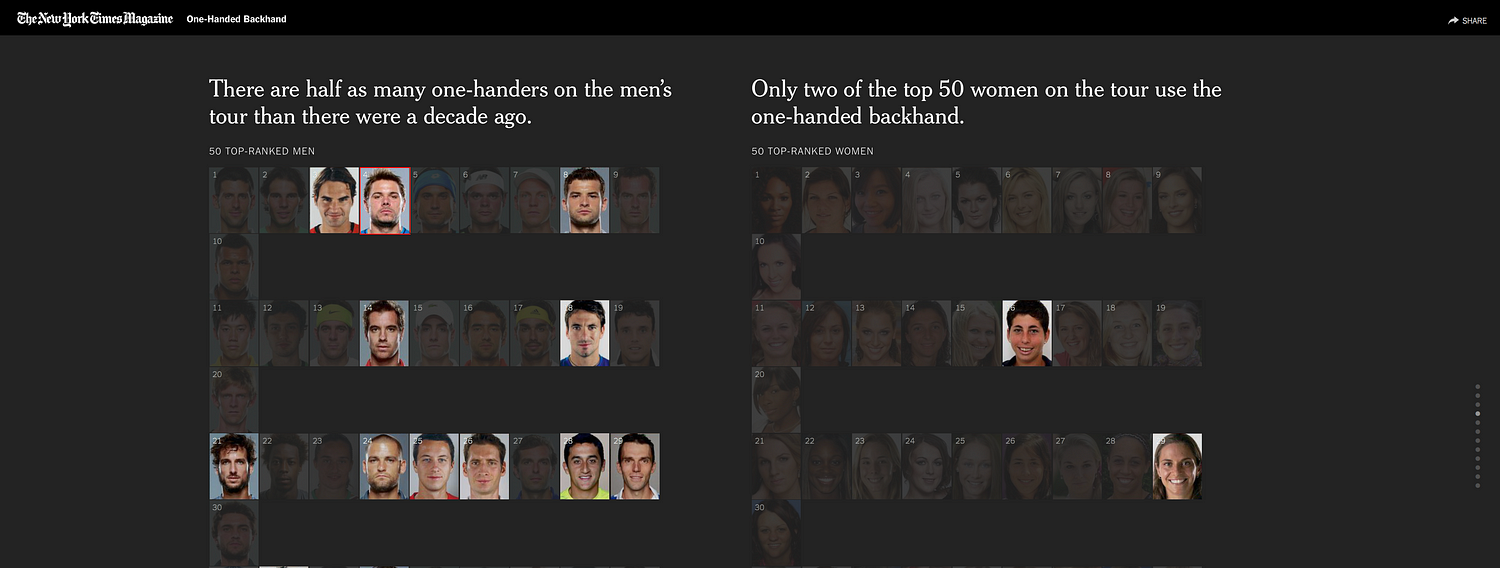
The “One-handed backhand project” by The New York Times
And this one, is an example where the Times newspaper worked with the Football Association to build a game for their audience to show how difficult or easy it is to referee (The Wall Street Journal did a similar one with being a tennis line judge). So working with analysts really does help.
What makes a good sports data story?
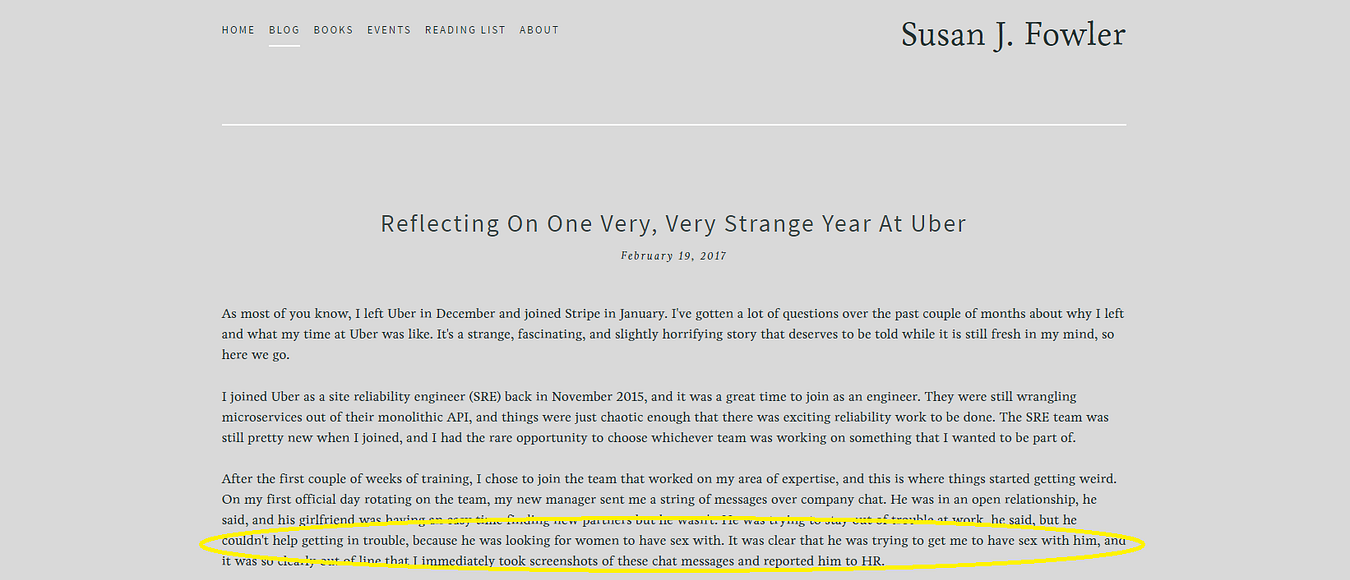
Steve Doig: Much of my career has been in investigative work, so I lean towards stories that investigate problems. A good example is the ‘Tennis Racket’ investigation by Buzzfeed’s John Templon and Heidi Blake.

The Tennis Racket investigation by BuzzFeed News
I also like fun stories, which can be created out of novel use of data. I’ve always argued that data journalism in general adds evidence to stories that otherwise would be collections of anecdotes. So sports data can do the same, I think. The data at least adds weight to the arguments being made about strategies or player choices, etc.
Nassos Stylianou: I don’t think this is different from any news story really –although it can be a lot more fun! So as with data journalism in general, a [good sports data story is a] story that tells you something new in a visually engaging way.
Malcolm Coles: A good sports data story is the same as any other good story really. I’ve tended to be more interested in how you can use data to visualise a story that you would otherwise tell in lots of complicated words.
Tips on visualising sports data
Nassos Stylianou: Always think of who your audience is. Many sports fans could be used to a certain type of visualisation that makes sense to them but makes no sense to other people. If you are aiming your story in their direction, you can work with that in mind but if you want this to go beyond the sport obsessive, that’s not always the best strategy.
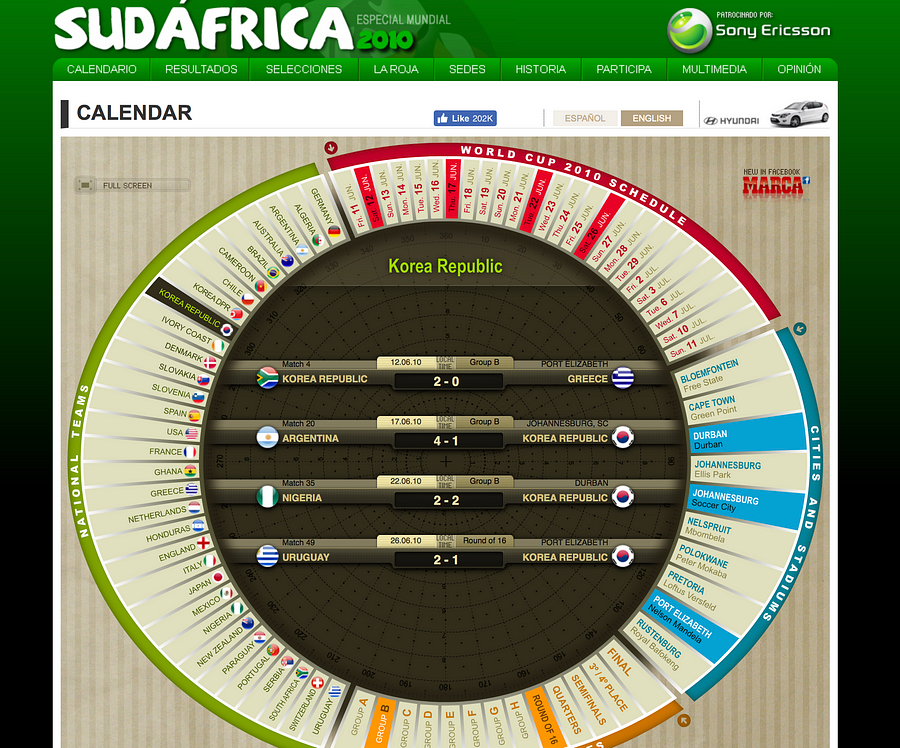
Malcolm Coles: I think a good visualisation is one that works on a mobile phone … I get shown this visualisation (pictured left) on the 2010 World Cup every year. It’s just fixtures data visualised — was great for its time. I get asked to build one like it every year, yet it won’t work on a mobile.
Steve Doig: Be aware of the growing number of sports analytics conferences being organized. The original, I believe, is the MIT Sloan Sports Analytics Conference held each year in Boston. About 1,800 young MBA students from all over the country (and now the world) show up trying to get hired as data analysts by sports leagues.
How do you get ready for big sports events like the Olympics, the Superbowl, or the Football World Cup?
Steve Doig: I’d say, do the same thing the on-air commentators do: gather all the relevant historical stats and be ready to use them in your stories. It’s also good to have stable of data analytics experts whose voices you can add to your stories.
Nassos Stylianou: Yep, prep well in advance. The great thing with these big events is also to build things that will work throughout the tournament.
Malcolm Coles: Try and build stuff outside of one off stories or investigations that you can reuse when the big tournament is over.
To see the full discussion, check out previous ones and take part in future ones, join the Data Journalism Awards community on Slack!
Over the past six years, the Global Editors Network has organised the Data Journalism Awards competition to celebrate and credit outstanding work in the field of data-driven journalism worldwide. To see the full list of winners, read about the categories, join the competition yourself, go to our website.