How crowdsourcing is changing science

THE BOSTON GLOBE – By Gareth Cook

At the end of the 19th century, a team of British archeologists happened upon what is now one of the world’s most treasured trash dumps.

The site, situated west of the main course of the Nile, about five days journey south of Memphis, lay near the city of Oxyrhynchus. Garbage mounds are always a sweet target for those interested in the past, but what made the Oxyrhynchus dump special was its exceptional dryness. The water table lay deep; it never rained. And this meant that the 2,000-year-old papyrus in the mounds, and the text inscribed on it, were remarkably well preserved.

Eventually some half a million pieces of papyrus were drawn from the desert and shipped back to Oxford University, where generations of scholars have been painstakingly transcribing and translating them. The manuscripts are rich, fascinating, and varied. The texts include lost comedies by the great Athenian playwright Menander, and the controversial Gospel of Thomas, along with glimpses of daily life — personal notes, receipts for the purchase of donkeys and dates — and the occasional scrap of sex magic. [Read more…]

Thoughts from the Global Investigative Journalism Conference


OPEN SPENDING.ORG –  by 

This post is by Lucy Chambers, community coordinator at the Open Knowledge Foundation, and Friedrich Lindenberg, Developer on OpenSpending. They recently attended the Global Investigative Journalism Conference 2011 in Kyiv, Ukraine, and in this post, bring home their thoughts on journalist-programmer collaboration…

The conference

The Global Investigative Journalism Conference must be one of the most intense yet rewarding experiences either of us have attended since joining the OKF. With topics ranging from human trafficking to offshore companies, the meeting highlighted the importance of long-term, investigative reporting in great clarity.

With around 500 participants from all over the globe with plenty of experience in evidence gathering, we used this opportunity to ask many of them how platforms like OpenSpending can contribute, not only to the way in which data is presented, but also to how it is gathered and analyzed in the course of an investigation.

Spending Stories – the brainstorm

As many of you will be aware, earlier this year we won a Knight News Challenge award to help journalists contextualise and build narratives around spending data. Research for the project, Spending Stories, was one of the main reasons for our trip to Ukraine…

During the data clinic session as well as over drinks in the bar of “Hotel President” we asked the investigators what they would like to see in a spend analysis platform targeted at data journalists. Cutting to the chase, they immediately raised the key questions:

HOW WILL IT SUPPORT MY WORK?

It was clear that the platform should support the existing journalistic workflow through publishing embargos, private datasets and note making. At the same time, the need for statistical and analytical heuristics to dissect the data, find outliers and visualize distributions was highlighted as a means to enable truly data-driven investigations of datasets. The goal in this is to distinguish anomalies from errors and patterns of corruption from policies.

WHAT’S IN IT FOR MY READERS?

With the data loaded and analyzed, the next question is what value can be added to published articles. Just like DocumentCloud enabled the easy embedding of source documents and excerpts, OpenSpending should allow journalists to visualize distributions of funds, embed search widgets and data links, as well as information about how the data was acquired and cleaned.

WHAT DO I NEED TO LEARN TO DO IT?

Many of those we spoke to were concerned about the complexity required to contribute data. The recurring question was: should I even try myself or hire help? It’s clear that for the platform to be accessible to journalists, a large variety of data cleansing tutorials, examples and tools need to be at their disposal.

We’ve listed the full brainstorm on the OpenSpending wiki

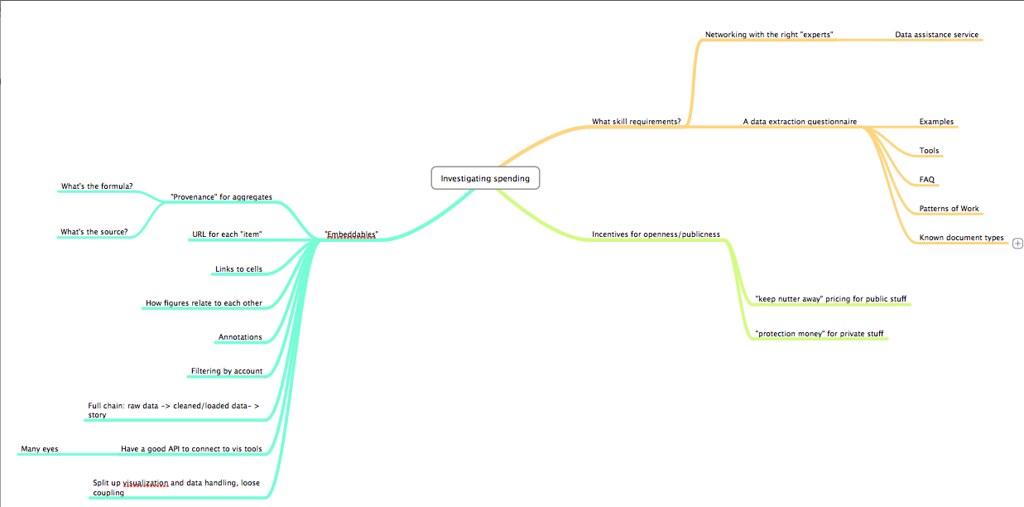
You can also see the mind map with concrete points below:

Hacks & Scrapers – How technical need data journalists be?

In a second session, “Data Camp” we went through the question of how to generate structured data from unstructured sources such as web pages and PDF documents. [Read more…]

Data Journalism – a new career


Monastic Musings Too – By Sister Edith

I had never heard of Data Journalism until a few weeks ago. I’m still not entirely sure I understand what it means – but there are seemingly job openings for Data Journalists.  Plenty of them.

What makes a person a data journalist? The ability to deal with data.  At first I thought this must be pretty simple: take a statistics class, learn the basics of data interpretation.  Want to know more? Take more statistics classes.  That was a social scientist‘s point of view – and it’s not true for data journalism.

Statistics vs Data Journalism

A data journalist definitely needs to know basic statistics.  No competent data journalist would confuse a proportion with a percentage, and then report that prices (or profits) had increased 1300%.  A data journalist understands the meaning of statistical significance, can accurately interpret reports of scientific research, and is energized, rather than terrified, but the presence of numbers.

The difference between the professions is found in the auxiliary skills.  A social scientist – the group most commonly compared to data journalists – expects to define variables, collect data that no one has collected before, or create unique data sets.  Even social scientists who specialize in secondary analysis – working with data collected by governments, international agencies, or public data sets – are interested primarily in exploring theories or evaluating which academic perspective is more likely to be true. So they study research methods, marinate themselves in the intricacies of social theories, and garner all the tools of academic discourse.

The data journalist does not expect or want to be the creator of data – although she may well aspire to be the one who combined existing data in new ways to generate a new perspective.  The data journalist needs all the skills of any journalist – tracking down all angles of a story, gathering the particular details and forming a coherent narrative that is supported by the facts of the situation.  For a data journalist, those facts are data – usually numbers – gathered by local, statewide, national, international governmental bodies as well as many non-profit agencies and dozens – hundreds – of public relations and advertising firms.  Oh yes – there’s also the data being generated by your cell phone,Facebook or Linked-In, your computer use and Google click-through, and the like.

Skills of the Data Journalist

Beyond the basics of statistics – understanding a frequency distribution table or a research report – the data journalist is an organizer of existing data.  They pursue topics not data sets or research agendas.  Rather than a long academic review of the literature on an issue like religious freedom or the psychological impact of unemployment, the data journalist wants to discover and create an underlying plot line, and support it with data from government reports, social scientists’ research projects, economic projections, and more. [Read more…]


A Case for Open Data in Transit [VIDEO]


STREET FILMS – by Elizabeth Press

Ever find yourself waiting for the next bus, not knowing when it will arrive? Think it would be great if you could check a subway countdown clock from the sidewalk? Or get arrival times on your phone? Giving transit riders better information can make riding the bus or the train more convenient and appealing. And transit agencies are finding that the easiest and least expensive way to do it is by opening data about routes, schedules, and real-time locations to software developers, instead of guarding it like a proprietary secret. [Read more…]


6 Data Journalism Blogs To Bookmark, Part 2

10,000 WORDS – By Elana Zak

Editor’s Note: This is the second part of a post from 10,000 Words. Find the first one here which included the Guardian’s Data Blog, Pro Publica and your very own Data Journalism Blog…

Last week, I started a list of six data journalism blogs you should take note of. The post stemmed from a project some journalists are leading to develop a data-driven journalism handbook that covers all aspects of the field. This weekend, thanks to a massive effort by attendees at the Mozilla Festival in London, the project morphed from the bare bones of an idea into something very tangible.

In just two days, 55 contributors, from organizations such as the New York Times, the Guardian and Medill School of Journalism, were able to draft 60 pages, 20,000 words, and six chapters of the handbook. The goal is to have a comprehensive draft completed by the end of the year, said Liliana Bounegru of the European Journalism Centre, which is co-sponsoring production of the handbook. If you’re interested in contributing, email Bounegru at bounegru@ejc.net. You can see what the group has so far atbit.ly/ddjbook.

Since the handbook is still being tweaked, why not check out these data journalism blogs?

Open
Like the Guardian, the New York Times is widely known for its spectacular use of data journalism and news apps. Open is written by the news organization’s developers, highlighting hacking events and describing general news of interest to the bloggers.

Data Desk
The Los Angeles Times is at the forefront of data journalism, with its Data Desk blog covering topics from crime to the Lakers to vehicle complaints. Everything on the site is a great example of how to use data to find and craft stories that will matter to your readers. One project I highly recommend you take a look at is mapping LA’s neighborhoods. It is something that could be replicated in almost any town and would grab your audience’s’ attention.

News Apps Blog
The News Apps blog is where developers from the Chicago Tribune discuss “matters of interest” and give their tips and suggestions on how to make some of the stunning maps and apps that appear in the paper. This is one of, if not the, place to go to see what experts in the field are talking about.

What data journalism blogs do you go to?

Image from the Data Journalism Handbook presentation.

6 Data Journalism Blogs To Bookmark, Part 1


Editor’s note: We are not publishing this article about data journalism blogs to bookmark just because the DJB is one of them. Alright, partly because of that but also because we think the other blogs mentioned  are the ultimate references for data journalism. Also because it mentioned the Mozilla Festival and that we really loved the event. Which blogs would YOU add to the list? Let us know in the comment section!

10,000 WORDS – By Elana Zak

Today is the start of Mozilla Festival, a weekend-long celebration of sorts that brings together web developers, journalists, media educators and students to work on open web projects and learn from one another. #MozFest’s program includes design challenges, learning labs, presentations and more. There will also be plenty of time for people to simply chat with one another and possibly brainstorm the next idea that will transform the web.

One event that stood out to me calls for a group to kickstart the writing of a data-driven journalism handbook. Led by the Open Knowledge Foundation and the European Journalism Centre, the project’s goal is to create a handbook that will “get aspiring data journalists started with everything from finding and requesting data they need, using off the shelf tools for data analysis and visualisation, how to hunt for stories in big databases, how to use data to augment stories, and plenty more.”

Data journalism has quickly become a popular field yet many reporters are still in the dark about it. How do you go about getting the data? What do you do once you have the data? A perfect resource would be the data journalism handbook, but since it hasn’t been written yet, I came up with a list of six blogs that should definitely be added to your bookmarks tab, whether you’re looking for inspiration, basic skills, or advanced knowledge.

The first three are below and the last half will be published on Monday.

ProPublica Nerd Blog

ProPublica is constantly creating amazing tools using data journalism. In the last year, they’ve created apps that delve into topics such as education and healthcare. On the Nerd Blog, members of ProPublica’s News apps desk not only explain the latest apps and how to use them but also how the team created them. I highly recommend you check out the post, “Scraping for Journalism: A Guide for Collecting Data.” Dan Nguyena ProPublica news developer, gives a step-by-step explanation of how the team created itsDollars for Docs app and shows readers exactly what tools to use to recreate the app (or even make another one.)

The Guardian’s Data Blog

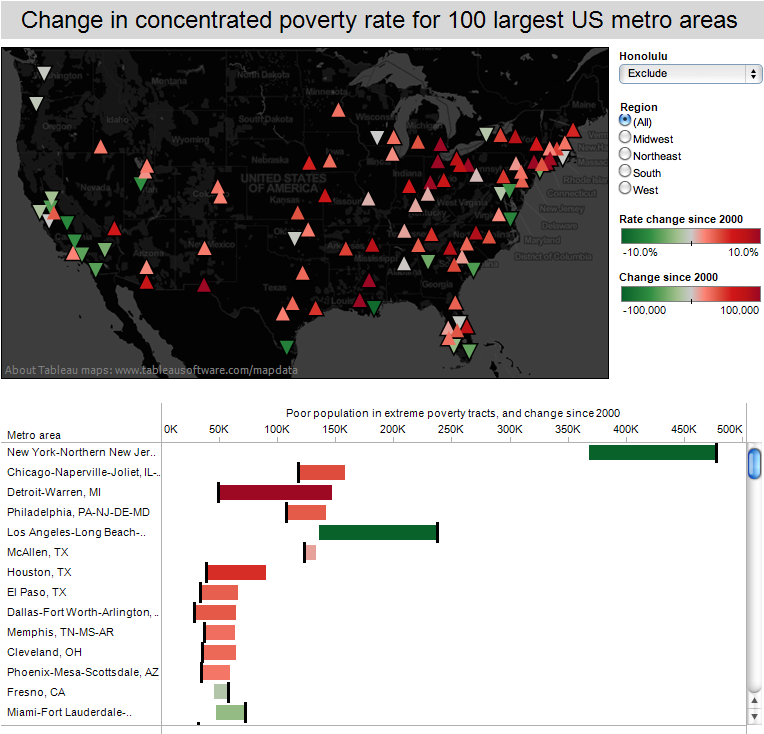
Almost every week, The Guardian is rolling out stories and graphics based on data journalism, many of which are highlighted on its Data Blog, making it a great place to go for inspiration. For example, take a look at their story on where the super poor are in the US. It includes maps and charts, all derived from a ton of data. While the site is aimed at already experienced data journalists, it is a great place for all levels to go and see what the experts in the field are doing.

Data Journalism Blog

The Data Journalism Blog isn’t specifically attached to any one news organization but instead acts more as an overall resource for data journalists. The site, led by multimedia journalist Marianne Bouchart, not only displays examples of great graphics, but it also provides how-tos, guides, and interviews with other data journalists. If you’re looking for a new concept to try out or where the next data journalism seminar will be held, I’d recommend visiting this blog.

Don’t forget to check back on Monday for Part 2: 6 Data Journalism Blogs To Bookmark.

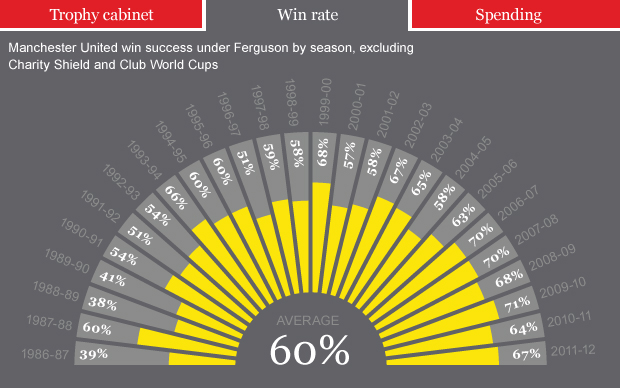
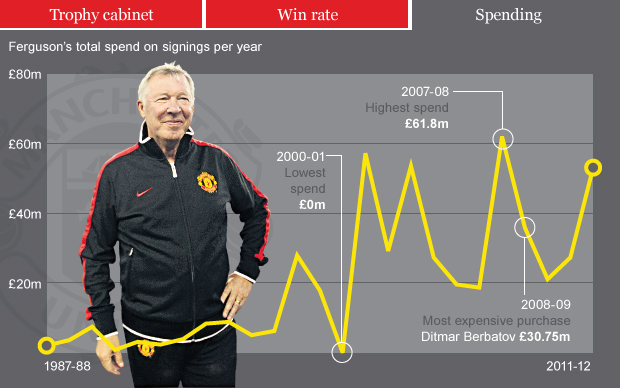
Graphic: Key data behind Sir Alex Ferguson’s 25 years at Old Trafford

THE TELEGRAPH – By Michael Norrish

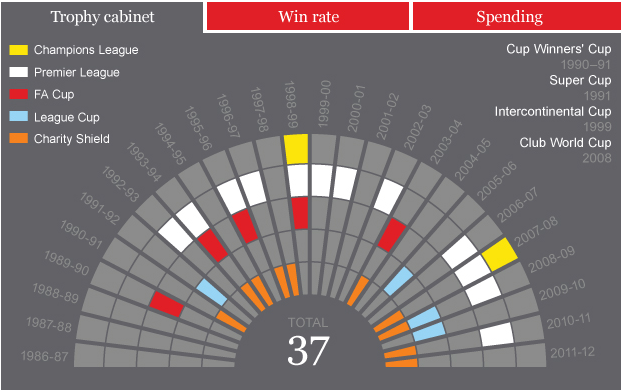
In the build-up to Sir Alex Ferguson’s 25th anniversary at Manchester United, we chart the key data which have defined his managerial career at Old Trafford

Sunday marks a quarter of a century since Sir Alex Ferguson moved from Aberdeen to join Manchester United, who were then in the relegation zone and without a title since 1967. The next quarter of a century has reaped 12 league titles, two European Cups and five FA Cups.

The tales of Robins, Rotterdam and Ronaldo are now so familiar, they hardly need recounting again, but the longevity of his reign at United can hardly be overemphasised. When he began at Old Trafford, Chelsea manager Andre Villas Boas was eight years old. [Read more…]

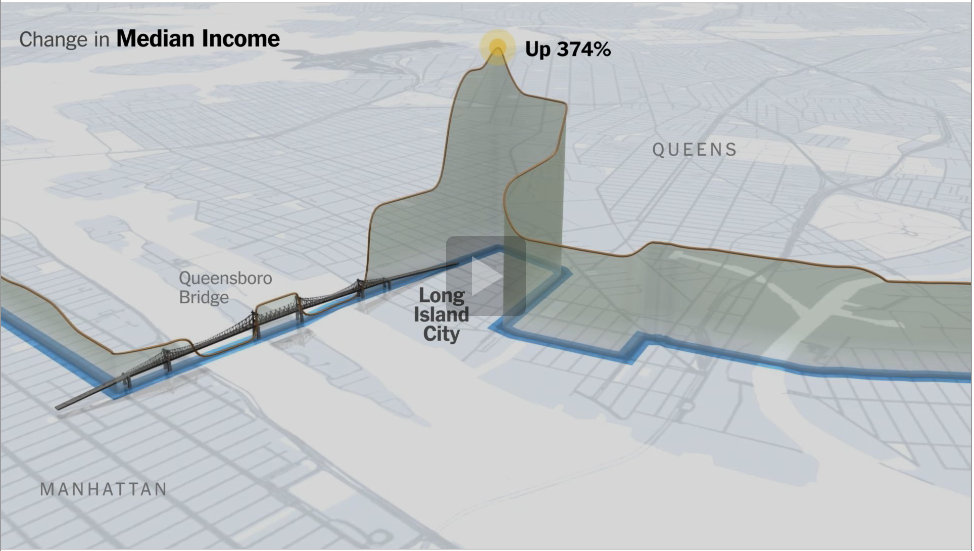
The Marathon Route’s Evolving Neighborhoods

THE NEW YORK TIMES – By  GRAHAM ROBERTS, ALAN McLEAN, ARCHIE TSE, LISA WAANANEN, TIMOTHY WALLACE, XAQUIN G.V., JOE BURGESS and JOE WARD

The New York City Marathon course has changed little since it first wound its way through all five boroughs in 1976. But the neighborhoods along the route have seen significant change: they are mostly richer and the ethnic makeup of many of them has shifted.

 [Read more…]

TOP 10 INFOGRAPHICS

AWESOME INFOGRAPHICS

Editor’s note: Here is a top 10 of the best data visualisations according to the blog Awesome Infographics, and they are pretty good indeed! Now we want to hear about you: what is your top data visualisation? Have you come across a stunning infographic lately? Tell us in the comment section..

ONE

Visualising Alcohol Use: What Percentage of the U.S. Drinks Regularly?

Neck it Infographic

Brought to you by Phlebotomist.net


TWO

The World’s Resources by Country

Cool Infographics

Credit: British Geological Survey


THREE

A HAND DRAWN infographic. Non of that inDesign bullshit for this guy.

Hand Drawn Infographic


FOUR

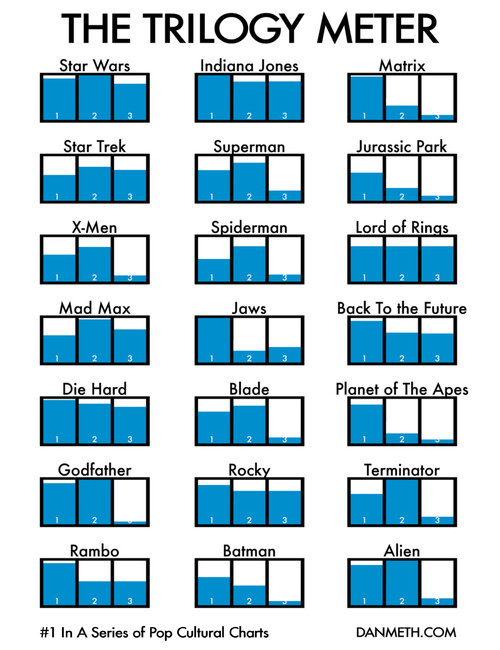
The Trilogy Meter

Trilogy Meter

FIVE

The Jedi Trainer’s Guide to Employee Management

Star Wars Infographic

Thanks to www.MindFlash.com for this one. [Read more…]