3 Golden Rules to #ddj — Ændrew Rininsland

1. Tell the reader what the data means

Tools like Tableau make it really easy to make exploratory visualisations, giving the user the ability to sift through the data and localise it to themselves. However, as tempting as this can be, the role of the data journalist it to tell the reader what the data means — if you have a dataset that includes the entire country but only a handful of locations are relevant to your story, an exploratory map isn’t the best approach. Aim for explanatory visualisations.


2. Simple is usually better

A quick glance through the examples page of d3js.org reveals a wealth of different and unusual ways to visualise data. While there are definitely occasions where an exotic visualisation method communicates the data more effectively than a simple line or pie chart, these are really rather rare. The Economist’s use of series charts to efficiently summarise an entire article in a tiny space demonstrates how effective the “classic” visualisation types are — there’s a reason they’ve stood the test of time (The Economist’s incredibly clear descriptions and simple writing style also really help here). Meanwhile, I don’t think I’ve ever gained any insights from a streamgraph, pretty as they are.


3. Code for quality

News moves really quickly, which can make it exceptionally difficult to code for quality over speed. Nevertheless, all aspects of your data visualisation need to work — a bug causing a minor element like a tooltip to not update or report the wrong data can at best reduce reader confidence, or at worst, taint a long and costly investigation, possibly even leading to libel proceedings. This is made all the more difficult by the fact that JavaScript is what’s referred to as a “weakly typed” language, meaning that variable types (strings, numbers, objects, et cetera) can mutate over the course of a script’s execution without throwing errors — for instance, `Number(a + b)` will either return the sum of `a` and `b` or the concatenated value of those two variables (e.g., `’1’ + ‘2’ = ‘12’`), depending on whether they’re strings or numbers to begin with. This can be incredibly difficult to discover and troubleshoot. Fortunately, projects like Flow and TypeScript seek to add type annotations to JavaScript, effectively solving this problem (My recent open source project, generator-strong-d3, makes it really easy to scaffold a D3 project using either of these). Another way to improve code quality is to provide automated tests, which are a bit more work at the outset but will prevent bugs from cropping up as you get frantic towards deadline. “Test-Driven Development” (TDD) is a good practise to get into as it encourages you to write tests at the very beginning and then develop until those pass. It’s also a lot faster than writing tests later (or not at all, i.e., “cowboy coding”) once you get the hang of it, as you can save a lot of time avoiding the “make a change, refresh, manually execute a behaviour, evaluate output, repeat” cycle.


Aendrew-Rininsland-profile-picture

Ændrew Rininsland is a senior newsroom developer at The Times and Sunday Times and all-around data visualisation enthusiast. In addition to Axis, he’s the lead developer for Doctop.js, generator-strong-d3, Github.js and a ludicrous number of other projects. His work has also been featured by The GuardianThe Economist and the Hackney Citizen, and he recently contributed a chapter to Data Journalism: Mapping the Future?, edited by John Mair and Damian Radcliffe and published by Abramis. Follow him on Twitter and GitHub at @aendrew.

Developers at The Times create Axis

When we started our Red Box politics vertical at The Times, we needed the ability to quickly generate charts for the web in a style that was consistent with the site’s design. There had been a few attempts to build things like this; we considered using Quartz’s Chartbuilder project for quite some time, but ultimately felt its focus on static charts was a bit limiting. From this, Axis was born, which is both a customisable chart building web application and a framework for building brand new applications that generate interactive charts. It’s also totally open source, and free for anyone to use.

01102015-Axis2
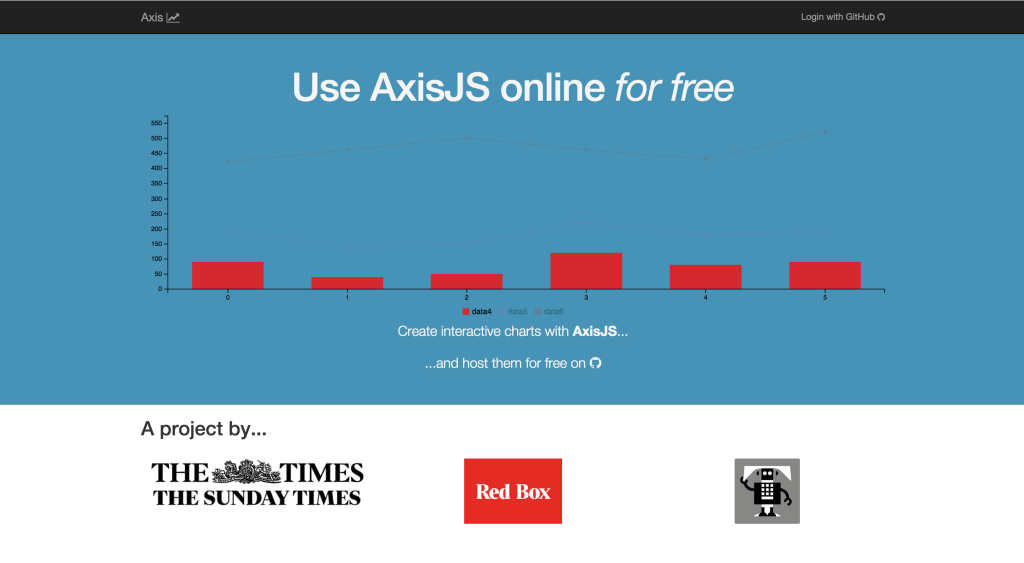
Axismaker (use.axisjs.org)

Design considerations

From the outset, we set a few broader project goals, which have persisted over the last year as we’ve developed Axis:

  1. Enable easy creation of charts via a simple interface
  2. Accept a wide array of data input methods
  3. Be modular enough to allow chart frameworks to easily be replaced
  4. Allow for straightforward customisation and styling
  5. Allow for easy integration into existing content management systems
  6. Allow journalists to easily create charts that are embeddable across a wide array of devices and media

At the moment, the only D3-based charting framework Axis supports is C3.js (which I’m also a co-maintainer of), though work is underway to provide adapters for NVD3 and Vega. This means Axis supports all the basic chart types (line, bar, area, stacked, pie, donut and gauge charts) and will gain new functionality as C3 evolves. Of course, once other charting libraries are integrated and adding new ones is more straightforward than it currently is, the sky’s the limit in terms of the types of charts Axis will be able to produce.


This is all possible because Axis isn’t so much a standalone webapp as a chart application framework. In order to achieve this level of modularity, Axis was built as an AngularJS app making extensive use of services and providers, meaning it’s relatively simple to swap around various components. As a nice side effect of this, it’s really easy to embed Axis in a wide variety of content management systems — at present, we’ve created a WordPress plugin that integrates really nicely with the media library and is currently one of the more feature-rich chart plugins out there for WordPress, plus a Drupal implementation is being developed by the Axis community. Integrating Axis into a new content management system is as difficult as extending the default export service — for instance, Axisbuilder is a Node-based server app that saves charts directly to a GitHub repo supplied by the user and is intended more for general public use, whereas Axis Server saves chart configurations into a MongoDB database and is intended more for news organisations who want to use it as a centralised internal tool. It can also be used entirely without a server component, depending on the needs of the organisation using it.


01102015-Axis3
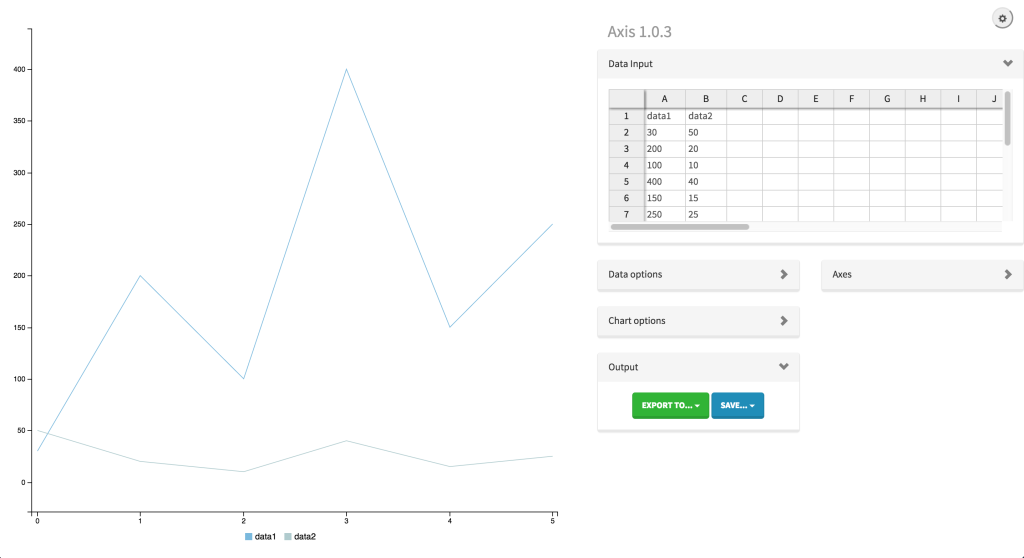
Main interface for Axis


Output is king

Charts are used universally by news organisations, whether that be in print, on the website or in a mobile app. As such, Axis was built to provide for a very wide variety of use cases — you can save Axis charts as a standalone embed code that can be pasted into a blog or forum post, Axis charts can be exported to a CMS, they can be saved as PNG for the web or SVG for print. In fact, print output is an important feature we’ve been developing recently so that chart output is ready to be placed in InDesign or Methode with little-or-no further tweaking. At the moment, basic charts for print at The Times and Sunday Times are produced by hand in Adobe Illustrator. The hope is that we can save our talented illustrators countless hours by dramatically reducing the time it takes to produce the large number of simple line graphs or pie charts needed for a single edition. The extensible configuration system means that customising the design of the output for a new section or title is as difficult as copying a config and CSS file and then customising to suit.


Proudly open source

Although Axis has been in development for just over a year, it’s really feature-rich — mainly as a result of working directly with journalists across The Times and Sunday Times to create the functionality they need. There are still a few sundry features we want to implement here and there, but ultimately the rest of version 1 will focus on stability and performance improvements. Version 2 — release date rather far into the future; we’re only in the pre-planning stages — will break away from this, with a restructuring of the internals, a redesign of the interface, and a whole boatload of new features.

Although we’ve built Axis with Times journalists in mind, we truly want it to grow as an open source project and welcome contributions both large and small (for example, we recently added i18n support, and are currently looking for translators to help internationalise the interface into different languages). Though designed to be powerful enough to support major news organisations, Axis is simple enough for anyone to use, and we particularly hope that student newspapers running WordPress will be encouraged to explore data journalism and visualisation using Axis.

For more about Axis and its related projects, please visit axisjs.org or follow us on Twitter at @axisjs. To try using Axis, visit use.axisjs.org.


Aendrew-Rininsland-profile-picture


Ændrew Rininsland is a senior newsroom developer at The Times and Sunday Times and all-around data visualisation enthusiast. In addition to Axis, he’s the lead developer for Doctop.js, generator-strong-d3, Github.js and a ludicrous number of other projects. His work has also been featured by The Guardian, The Economist and the Hackney Citizen, and he recently contributed a chapter to Data Journalism: Mapping the Future?, edited by John Mair and Damian Radcliffe and published by Abramis. Follow him on Twitter and GitHub at @aendrew.

Semantic Web and what it means for data journalism

I’ve found myself increasingly interested by the semantic web in recent months, particularly in how it could be applied to data journalism. While the concept is still somewhat in its infancy, the potential it holds to quickly find data — and abstract it into a format usable by visualizations — is something that all data journalists should take note of.

Imagine the Internet as one big decentralized database, with important information explicitly tagged — instead of just a big collection of linked text files, organized on the larger document level, such as it currently is. In the foreseeable future, journalists wanting to answer a question will simply have to supply this database with a SQL-like query, instead of digging through a boatload of content or writing scrapers. Projects like Freebase and Wikipedia’s burgeoning “Datapedia” provide some clues as to the power of this notion — already, the semantic components of Wikipedia make it incredibly easy to answer a wide variety of questions in this manner.

Take, for example, the following bit of SPARQL, a commonly used semantic web query language:

SELECT ?country ?competitors WHERE {
?s foaf:page ?country .
?s rdf:type .
?s "2012"^^ .
?s dbpprop:competitors ?competitors
} order by desc(?competitors)

If used on DBPedia (a dataset cloning Wikipedia that attempts to make its data usable as semantic web constructs), this fairly straight-forward 6-line query will return a JSON object listing all countries participating in the London 2012 Olympics and the number of athletes they’re sending. Go ahead — try pasting the above snippet into a DBpedia SPARQL query editor, such as the one at live.dbpedia.org/sparql. To accomplish a similar feat would take hours of scraping or data gathering. Because it can provide results in JSON, CSV, XML or whatever strikes your fancy, the output can then be supplied to some piece of visualization, whether that’s simply a table or something more complex like a bar chart.

One nice thing about SPARQL is that a lot of the terminology becomes self-evident once you get the hang of it. For instance, if you want to find the properties of the OlympicResult ontology, you merely have to visit the URL in the rdf:type declaration. That will also link to other related ontologies and you can thus find the definitions you need to construct a successful query. For instance, try going to dbpedia.org/page/Canada_at_the_2012_Summer_Olympics, which is the page I used to derive most of the ontologies and properties for the above query. From that page, you learn that entities in the “olympic result” ontology are assigned a “dbpprop:games” property (I.e., the year of the games) and a “dbpprop:competitors” property (I.e., the number of competitors, a.k.a., your pay dirt).

Here’s another, more complex SPARQL query, taken from DBpedia’s documentation:

SELECT DISTINCT ?player {
?s foaf:page ?player.
?s rdf:type .
?s dbpedia2:position ?position .
?s ?club .
?club ?cap .
?s ?place .
?place ?population ?pop.
OPTIONAL {?s ?tricot.}
Filter (?population in (, , ))
Filter (xsd:int(?pop) >10000000 ) .
Filter (xsd:int(?cap) Filter (?position = "Goalkeeper"@en || ?position = || ?position = )
} Limit 1000

This selects all pages describing a “player”, of type “SoccerPlayer”, with position “goalkeeper”, playing for a club with a stadium capacity of less than 40,000 and born in a country with a population of greater than 10 million. Producing such a list without semantic web would be mind-numbingly difficult and would require a very complex scraping routine.

Some limitations

That said, there are some limitations to this. The first is that the amount of well-structured semantic web data out there is limited — at least in comparison with non-semantic web data — though that is growing all the time. Wikipedia/DBpedia seems to be the most useful resource for this by far at the moment, though it’s worth noting that semantic web data from Wikipedia suffers from the same problems that all data from Wikipedia suffers from — namely, the fact that it’s edited by anonymous users. In other words, if something’s incorrect on Wikipedia, it’ll also be wrong in the semantic web resource. Another aspect of this is that Wikipedia data changes really quickly, which means that the official DBpedia endpoint becomes outdated really quickly. As a result, it’s often better to use live.dbpedia.org, which enables a continuous synchronization between Wikipedia and DBpedia.

The other thing you have to watch out for is data tampering. If your visualization is hooked up to a data source with little editorial oversight and the ability of users to edit data, the possibility always exist that one of those users will realize that data set is hooked up to your live visualization on a newspaper website somewhere, and will thus try to tamper with the data in order to make it full of profanity or whatnot. As such, while semantic web data from DBpedia might be a good way of getting the initial result, saving that result as a static object within your script afterwards might be the safest course of action.

Making Google Spreadsheets speak intelligible JSON

Audience: Intermediate
Skills: Javascript, PHP

When collaboratively constructing datasets to be consumed by interactive graphics, a Google Spreadsheet is often where everything starts. This makes a lot of sense — the cloud-based nature of the document means it’s very accessible and doesn’t need to be emailed around to everyone with each revision, multiple people can simultaneously work on it without having to worry about syncing a bunch of changes and it’s easier to use than a relational database (or even the back-end tools to manipulate such databases; for instance, phpMyAdmin.).

However, what about when the dataset’s finished? One completed, it likely has to then be exported as a CSV and imported into a database, or, worse yet, manually reproduced in another web-consumable format — for instance, JSON.

If your dataset never changes and everyone on your team knows how to move the data from Google Spreadsheets into the web-consumable format, this might not be a problem. But what about if that data changes frequently? Or what if you’re on the development end of the project and want to start building the interactive before the dataset is complete?

Clearly what’s needed is a way to make Google Spreadsheets speak JSON. Google has two built-in ways of doing this, but neither works very well — the actual spreadsheet data is buried under several layers of metadata and, worse yet, header rows don’t map to anything. These reasons combined make it difficult to use for anything more complex than a simple list.

Luckily, a great bit of code from Rob Flaherty solves this problem quite nicely. I’ll briefly go into how to use it:

    1. First, your Google Spreadsheet needs to be “published.” Note that this doesn’t mean it’s fully available online — how visible it is reflects whatever value is selected in “Sharing” settings. In short, unless your data is set to “Public on the web,” you don’t really need to worry about anyone finding it before you publish. To make it consumable for JSON, go File, Publish to the Web… and click Start Publishing. Under “Get a link to the published data,” select “CSV (comma-separated values)” and copy the URL it gives you to the clipboard.
    2. Download the CSV to JSON script and upload it to a PHP-enabled directory of your webserver.
    3. Paste the URL from step 1 into the $feed variable.

This will work fine for a local AJAX request. However, because of AJAX’s same origin requirement, you won’t be able to consume data from the script on domains outside of the one it’s being hosted on. This is problematic if, for instance, your newspaper’s tech team won’t let you run random bits of PHP on your pages and you are thus wanting to host the above script on ScraperWiki, or if you’re wanting to create a web-service that lets your readers consume the data as JSON.

The way around this is to use JSONP, which is essentially regular JSON wrapped in a callback. This lets you use jQuery’s getJSON(); function like so:


jQuery.getJSON(’http://www.aendrew.com/csv-to-jsonp.php?callback=?’, function(response) {
//code for consuming JSON here -- JSON object returned as variable “response”
});

To do so, simply change the header value in the CSV to JSON script from “application/json” to “script/javascript” and replace the last line with the following:


echo $_GET['callback']. '(' . json_encode($newArray) . ');';

Alternately, I’ve posted a modified fork of Flaherty’s code here.

Notes:

    1. Depending on the debug level of your version of PHP, you might get warnings about array_combine(); on line 55. Place an @ in front of that function to suppress them.
    2. The CSV to JSON script uses the first row as column headings, which are mapped as the name of each item in the JSON response. Make sure no two column headings are identical — otherwise, the first one will be overwritten by the second.