
 Here I have created a visualisation showing patients detained under the Mental Health Act 1983 over the last six years.
I took statistics from the mental health pages of the NHS website and downloaded them into an Excel spreadsheet. I then cleaned the data, taking out any information that was unnecessary and that would confuse the image. I rearranged the columns, data and information and made it easier to understand and clearer, visually.
I then experimented with Many Eyes, Google Docs and Excel graphs to create the visualisation. I tried other ways of presenting the image, in a pie chart and a line graph, but found that the bar chart worked best.
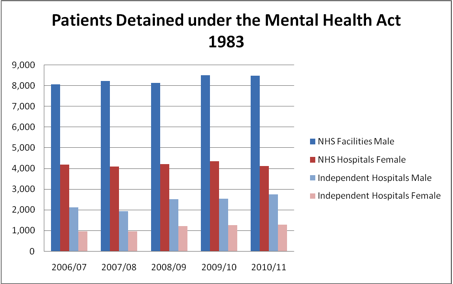
The information is broken down by gender as well as by type of hospital; NHS Facilities and Independent hospitals. The graph shows that more men have been detained under the mental health act than women, on a year by year basis. This is consistent with both NHS Facilities and Independent Hospitals. The number of men detained has also gone up marginally in the last two years, though has stayed relatively consistent over the last six years.
This is interesting because statistics have indicated that more women than men are diagnosed with mental health disorders, such as depression and anxiety. However, when it comes to severe cases, where patients are legally detained due to mental illness, men are significantly more likely to be affected.