VISUALISATION ANALYSIS #3

http://www.guardian.co.uk/news/datablog/interactive/2012/mar/26/office-for-national-statistics-health

Simon Rogers has published a fantastic interactive graphic for the Guardian Datastore that maps teenage pregnancy rates in England and Wales from 1998 to 2010.

The visualisation shows the conception rate of under-eighteen year olds, per 1000 women, in different counties across England and Wales. The interactive map is an ideal way to present the information, as the visualisation contains a large amount of data in a comprehensible way. From the graphic we can derive that the number of teenage pregnancies has declined in the last decade, although this varies by area.

In order to focus on a specific county the user can scroll the mouse over the map and click on a different area, labelled by county at the side of the map. Once you click on a county the line graph changes to show the counties’ change in number of teenage pregnancies by year and how this compares to the England and Wales average. This allows the user to have more detailed and specific information simply by clicking on the infographic. Thus the graphic allows users to see the more personalised, local data.

By using this tool the user can focus on various localised data, and see how they compare with each other. For example, in Wales it is apparent that poorer counties, such as Merthyr Tydfil and the South Wales Valleys, are significantly over the national average regarding the number of teenage pregnancies. In contrast, geographically close but wealthier counties like Monmouthshire and Powys are below the national average. In most cases this has not altered over the decade.

The map thus proves that in certain circumstances seeing only the larger data can give a limited understanding, as it shows a national decline in the number of teenage pregnancies but does not tell us that many individual counties have not changed significantly. In this way a graphic of this kind presents to users the ‘big picture’, in a clearer way than text alone.

The graphic also allows users to ignore information that is not of interest to them and to focus on geographical locations that are. This gives users a certain amount of control over the visualisation, as information is not decided for the user, as would be the case with textual narrative.

The interactive element of the visualisation allows users to find the story or information for themselves with no difficulty. This is more satisfying than simply being told information. At a time when the general public’s trust in journalism is low, visualisations such as this demonstrate that the journalist has not played around and sifted information but presented all of it to the user and allowed them to draw their own conclusions. In this way the user can get a more detailed, accurate and neutral understanding of the issue presented. It also breaks down the barrier between journalist and user and implies trust in the user to interpret and organise the data in an intelligent way.

The graph also uses visual symbols to organise the large amount of data. The map of England and Wales is easily recognisable, as is many of the counties. The counties that are under the national average are a light shade of blue and this gets darker as the percentage increases. The use of blue and purple makes the map visually attractive and the differences in shade easily identifiable. It is apparent that darker areas cluster together and that generally the North of England is darker than the South. In this way the user can obtain information from the visualisation by looking at it alone. The darker shade of purple stands out amongst the generally lighter shades and thus the graphic signals to the reader some of the most dramatic information. Thus, although the user is given control and the freedom to explore the data and draw their own conclusions, visual signals guide them to the most extreme data.

The orange circle that is drawn around a county when it is selected contrasts with the blue, making it clear. It also correlates with the colour of the line graph, making the visualisation easily readable.

By pressing ‘play’ the user can focus on one county and see how it breaks down by each year, as well as how the colours across the UK has changed by year, thus presenting more information.

The visualisation thus works as it presents a large amount of data comprehensibly. It allows the user to interpret and organise the data, but gives them visual signals to guide them. It also gives information for the whole country, as well as localised data, thus presenting the ‘big picture’. It is clear and easy to read and breaks down the barrier between journalist and user. It is therefore an excellent way to present the data.


Visualisation Analysis #2

Simon Rogers has created a visualisation showing death penalty statistics, country by country, for the Guardian Data Blog.

http://bit.ly/hdFOpa

http://bit.ly/hflX1V

The visualisation uses a bubble graph on a map of the world to depict how many people have been given death sentences and how many people have been executed in 2011. This is then broken down by country, giving users the opportunity to compare and contrast regions.

Continue reading “Visualisation Analysis #2”

Visualisation Analysis #1

Following on from my earlier post exploring different ways to present data, I have decided to analyse two examples of visualisations from the Guardian Data Store.

http://bit.ly/HsqsLf

The first is a map of UK fuel shortages; ‘The Petrol Panic Mapped’. The map works because it is clear, simple and easy to use. The map is interactive, giving the user control and allowing them to display the information in the way that best suits them, prioritising data that they find most interesting. It also makes viewing the map a more entertaining experience, keeping users on the page for longer.

Continue reading “Visualisation Analysis #1”

How to find Data

This post is for people who are new to data sourcing, or interested in Data Journalism but unsure of where to begin.

First, it is useful to start with an idea, question or hypothesis. In Story Based Enquiry Mark Lee Hunter emphasises the importance of having an idea of what you are looking for in data.

He said: “We do not think that the only issue is finding information. Instead, we think that the core task is telling the story. Stories are the cement which holds together every step of the investigative process, from conception to research, writing, quality control and publication.”

Data stories and visualisations are part of journalism and, when looking for information, a good starting place is to use traditional journalistic methods. Contacts, tip offs, interviews and research can all point you in the direction of interesting data, and of questions that could be answered by statistics. This is known as Active Data Journalism.

Continue reading “How to find Data”

99% v 1%: the data behind the Occupy movement – animation


THE GUARDIAN’S DATABLOG – By  and 

It has been the rallying cry of the Occupy movement for the past two months – but is the US really split 99% v 1%? As poverty and inequality reach record levels, how much richer have the rich got? This animation explains what the key data says about the state of America today

• Explore the data behind this animation and read the script


Click on the picture below to watch the video on The Guardian’s website:


6 Data Journalism Blogs To Bookmark, Part 1


Editor’s note: We are not publishing this article about data journalism blogs to bookmark just because the DJB is one of them. Alright, partly because of that but also because we think the other blogs mentioned  are the ultimate references for data journalism. Also because it mentioned the Mozilla Festival and that we really loved the event. Which blogs would YOU add to the list? Let us know in the comment section!

10,000 WORDS – By Elana Zak

Today is the start of Mozilla Festival, a weekend-long celebration of sorts that brings together web developers, journalists, media educators and students to work on open web projects and learn from one another. #MozFest’s program includes design challenges, learning labs, presentations and more. There will also be plenty of time for people to simply chat with one another and possibly brainstorm the next idea that will transform the web.

One event that stood out to me calls for a group to kickstart the writing of a data-driven journalism handbook. Led by the Open Knowledge Foundation and the European Journalism Centre, the project’s goal is to create a handbook that will “get aspiring data journalists started with everything from finding and requesting data they need, using off the shelf tools for data analysis and visualisation, how to hunt for stories in big databases, how to use data to augment stories, and plenty more.”

Data journalism has quickly become a popular field yet many reporters are still in the dark about it. How do you go about getting the data? What do you do once you have the data? A perfect resource would be the data journalism handbook, but since it hasn’t been written yet, I came up with a list of six blogs that should definitely be added to your bookmarks tab, whether you’re looking for inspiration, basic skills, or advanced knowledge.

The first three are below and the last half will be published on Monday.

ProPublica Nerd Blog

ProPublica is constantly creating amazing tools using data journalism. In the last year, they’ve created apps that delve into topics such as education and healthcare. On the Nerd Blog, members of ProPublica’s News apps desk not only explain the latest apps and how to use them but also how the team created them. I highly recommend you check out the post, “Scraping for Journalism: A Guide for Collecting Data.” Dan Nguyena ProPublica news developer, gives a step-by-step explanation of how the team created itsDollars for Docs app and shows readers exactly what tools to use to recreate the app (or even make another one.)

The Guardian’s Data Blog

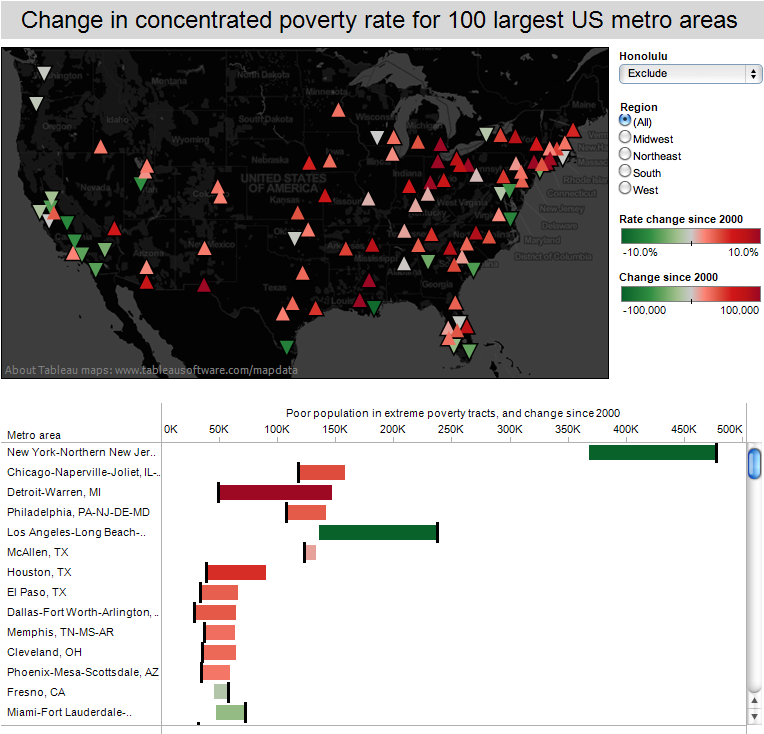
Almost every week, The Guardian is rolling out stories and graphics based on data journalism, many of which are highlighted on its Data Blog, making it a great place to go for inspiration. For example, take a look at their story on where the super poor are in the US. It includes maps and charts, all derived from a ton of data. While the site is aimed at already experienced data journalists, it is a great place for all levels to go and see what the experts in the field are doing.

Data Journalism Blog

The Data Journalism Blog isn’t specifically attached to any one news organization but instead acts more as an overall resource for data journalists. The site, led by multimedia journalist Marianne Bouchart, not only displays examples of great graphics, but it also provides how-tos, guides, and interviews with other data journalists. If you’re looking for a new concept to try out or where the next data journalism seminar will be held, I’d recommend visiting this blog.

Don’t forget to check back on Monday for Part 2: 6 Data Journalism Blogs To Bookmark.

Nato operations in Libya: data journalism breaks down which country does what

THE GUARDIAN’S DATA BLOG – By 

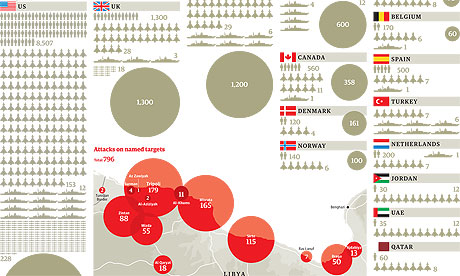
How many Nato attacks took place over Libya – and what did they hit? Here’s the most comprehensive analysis yet of who did what
• Get the data

Nato in Libya graphic


Nato‘s Libya operations have cost millions and involved thousands of airmen and sailors. But who’s contributed to Operation Unified Protector? That’s the official name for the attacks on the Gadaffi regime’s bases and tanks by Nato aircraft and ships, plus the enforcement of the no-fly zone and the arms embargo.

We have been monitoring the Nato situation updates which are released each day and give details of the operations – key targets hit, sorties flown and ships boarded.


Groundbreaking data tracks carbon emissions back to their source

THE GUARDIAN’S ENVIRONMENT BLOG – By 

A new scientific paper allows us to see which countries extracted the fossil fuels burned to support lifestyles in other countries

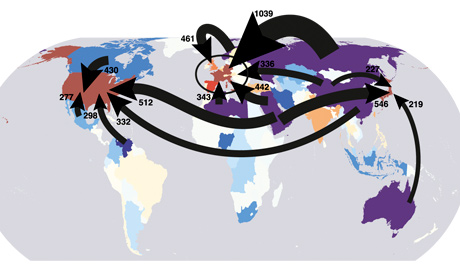
Overview of carbon flows from fossil fuel extraction to the final consumers of goods and services

 
Which of the following accounts for the largest share of the UK’s carbon footprint? All our holiday flights, all the power used in our homes or … Russia?

Okay, so it’s kind of a trick question, but according to a scientific paper published this week, we might reasonably conclude that the answer is Russia – though to understand why it’s necessary to go back a couple of steps.

For the purposes of the Kyoto treaty, a nation’s carbon footprint is considered to be a sum of all the greenhouse gas released within its borders. But as many people – myself included – have been pointing out for years, that approach ignores all the laptops, leggings, lampshades and other goods that rich countries import from China and elsewhere.

If we want any chance of a fair global climate deal, the now-familiar argument goes, we need to rethink the way we measure emissions to allocate some of the carbon pouring out of Chinese, Indian and Mexican factories and power plants to the countries importing good from those countries.

The new scientific paper, published in the Proceedings of the National Academy of Sciences, points out that this argument – though persuasive – tells only half of the story. If you want to understand how carbon footprints are affected by international trade flows, the paper argues, you need to consider trade not only in gadgets and garments but also in fossil fuels themselves. After all, though country X might import a television that was made in country Y, it’s quite possible that country Y in turn imported some of the coal, oil or gas consumed by the television factory from country Z. [Read more…]


Occupy protests around the world: full list visualised

THE GUARDIAN’S DATA BLOG – By 

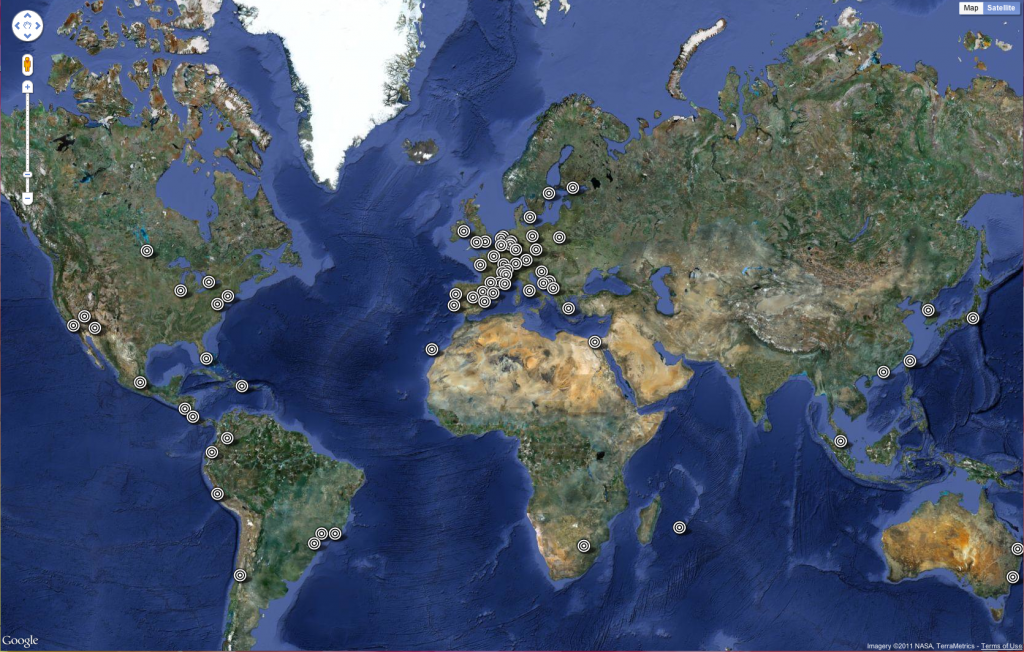
The Occupy protests have spread from Wall Street to London to Bogota. See the full list – and help us add more
• 
Get the data


“951 cities in 82 countries” has become the standard definition of the scale of the Occupy protests around the world this weekend, following on from the Occupy Wall Street and Madrid demonstrations that have shaped public debate in the past month.

We wanted to list exactly where protests have taken place as part of theOccupy movement – and see exactly what is happening where around the globe. [Read more…]