THE GUARDIAN’S ENVIRONMENT BLOG – By Duncan Clark
A new scientific paper allows us to see which countries extracted the fossil fuels burned to support lifestyles in other countries
Okay, so it’s kind of a trick question, but according to a scientific paper published this week, we might reasonably conclude that the answer is Russia – though to understand why it’s necessary to go back a couple of steps.
For the purposes of the Kyoto treaty, a nation’s carbon footprint is considered to be a sum of all the greenhouse gas released within its borders. But as many people – myself included – have been pointing out for years, that approach ignores all the laptops, leggings, lampshades and other goods that rich countries import from China and elsewhere.
If we want any chance of a fair global climate deal, the now-familiar argument goes, we need to rethink the way we measure emissions to allocate some of the carbon pouring out of Chinese, Indian and Mexican factories and power plants to the countries importing good from those countries.
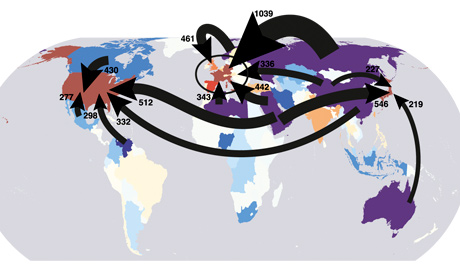
The new scientific paper, published in the Proceedings of the National Academy of Sciences, points out that this argument – though persuasive – tells only half of the story. If you want to understand how carbon footprints are affected by international trade flows, the paper argues, you need to consider trade not only in gadgets and garments but also in fossil fuels themselves. After all, though country X might import a television that was made in country Y, it’s quite possible that country Y in turn imported some of the coal, oil or gas consumed by the television factory from country Z. [Read more…]

