A Case for Open Data in Transit [VIDEO]


STREET FILMS – by Elizabeth Press

Ever find yourself waiting for the next bus, not knowing when it will arrive? Think it would be great if you could check a subway countdown clock from the sidewalk? Or get arrival times on your phone? Giving transit riders better information can make riding the bus or the train more convenient and appealing. And transit agencies are finding that the easiest and least expensive way to do it is by opening data about routes, schedules, and real-time locations to software developers, instead of guarding it like a proprietary secret. [Read more…]


The convergence of big data, baseball and pizza at Strata

SPLUNK BLOG – By Paul Wilke

Last week, I was fortunate enough to attend the Strata Big Data Conference in New York. With the conference spanning four days, two hotels, and over 400 attendees one thing stood out… big data is a hot topic!

Splunk was featured in two sessions. On Tuesday, Splunk CIO Doug Harr was part of a panel discussion on the changing role of the CIO, where he and the panel (which included CIOs from Batchtags, Accenture and Revolution Analytics) pointed out that the CIO  role is changing and expanding. The function has evolved into one of the most crucial positions in corporations focusing on sustainable growth.

On Friday Splunk Product Manager Jake Flomenberg took the stage with Denise Hemke from Salesforce.com to talk about gleaning new insights from massive amounts of machine data. Denise highlighted how at Salesforce a Chatter group is devoted to sharing ideas on how they work with Splunk so they can make the most of Splunk solutions. To highlight the usefulness of big data in a way that just about everyone could relate to, Jake showed how Splunk could be used to find the average price of pizza in New York City – definitely an example of using data for food, not evil!

Jake also gave a great interview at the conference, which you can see here:

[youtube RNGWPg27JVw]

Overall, a great crowd and very strong topics. One of my favorite sessions was current New York Mets’ executive Paul DePodesta talking about the big data behind Moneyball. It’s a shame the Mets aren’t taking it to heart this season. As the Splunk t-shirts we handed out at Strata say, “A petabyte of data is a terrible thing to waste”.

Read the original post on Splunk Blog here.

Data-Driven Journalism In A Box: what do you think needs to be in it?

The following post is from Liliana Bounegru (European Journalism Centre), Jonathan Gray (Open Knowledge Foundation), and Michelle Thorne (Mozilla), who are planning a Data-Driven Journalism in a Box session at the Mozilla Festival 2011, which we recently blogged about here. This is cross posted at DataDrivenJournalism.net and on the Mozilla Festival Blog.

We’re currently organising a session on Data-Driven Journalism in a Box at the Mozilla Festival 2011, and we want your input!

In particular:

  • What skills and tools are needed for data-driven journalism?
  • What is missing from existing tools and documentation?

If you’re interested in the idea, please come and say hello on our data-driven-journalism mailing list!

Following is a brief outline of our plans so far…

What is it?

The last decade has seen an explosion of publicly available data sources – from government databases, to data from NGOs and companies, to large collections of newsworthy documents. There is an increasing pressure for journalists to be equipped with tools and skills to be able to bring value from these data sources to the newsroom and to their readers.

But where can you start? How do you know what tools are available, and what those tools are capable of? How can you harness external expertise to help to make sense of complex or esoteric data sources? How can you take data-driven journalism into your own hands and explore this promising, yet often daunting, new field?

A group of journalists, developers, and data geeks want to compile a Data-Driven Journalism In A Box, a user-friendly kit that includes the most essential tools and tips for data. What is needed to find, clean, sort, create, and visualize data — and ultimately produce a story out of data?

There are many tools and resources already out there, but we want to bring them together into one easy-to-use, neatly packaged kit, specifically catered to the needs of journalists and news organisations. We also want to draw attention to missing pieces and encourage sprints to fill in the gaps as well as tighten documentation.

What’s needed in the Box?

  • Introduction
    • What is data?
    • What is data-driven journalism?
    • Different approaches: Journalist coders vs. Teams of hacks & hackers vs. Geeks for hire
    • Investigative journalism vs. online eye candy
  • Understanding/interpreting data:
    • Analysis: resources on statistics, university course material, etc. (OER)
    • Visualization tools & guidelines – Tufte 101, bubbles or graphs?
    • Acquiring data
  • Guide to data sources
  • Methods for collecting your own data
  • FOI / open data
  • Scraping
    • Working with data
  • Guide to tools for non-technical people
  • Cleaning
    • Publishing data
  • Rights clearance
  • How to publish data openly.
  • Feedback loop on correcting, annotating, adding to data
  • How to integrate data story with existing content management systems

What bits are already out there?

What bits are missing?

  • Tools that are shaped to newsroom use
  • Guide to browser plugins
  • Guide to web-based tools

Opportunities with Data-Driven Journalism:

  • Reduce costs and time by building on existing data sources, tools, and expertise.
  • Harness external expertise more effectively
  • Towards more trust and accountability of journalistic outputs by publishing supporting data with stories. Towards a “scientific journalism” approach that appreciates transparent, empirically- backed sources.
  • News outlets can find their own story leads rather than relying on press releases
  • Increased autonomy when journalists can produce their own datasets
  • Local media can better shape and inform media campaigns. Information can be tailored to local audiences (hyperlocal journalism)
  • Increase traffic by making sense of complex stories with visuals.
  • Interactive data visualizations allow users to see the big picture & zoom in to find information relevant to them
  • Improved literacy. Better understanding of statistics, datasets, how data is obtained & presented.
  • Towards employable skills.

€20,000 to win in The Open Data Challenge: Get crackin’!

So you are a data enthusiast? Here is a great opportunity to get noticed…

The Open Data Challenge is a data competition organised by the Open Knowledge Foundation, in conjunction with the Openforum Academy and Share-PSI.eu.

European public bodies produce thousands upon thousands of datasets every year – about everything from how our tax money is spent to the quality of the air we breathe. With the Open Data Challenge, the Open Knowledge Foundation and the Open Forum Academy are challenging designers, developers, journalists and researchers to come up with something useful, valuable or interesting using open public data.

Everybody from the EU can submit an idea, app, visualization or dataset to the competition between 5th April and 5th June. The winners will be announced in mid June at the European Digital Assembly in Brussels. A total of €20,000 in prizes could be another motivator if you’re not convinced yet.

All entries must use or depend on open, freely reusable data from local, regional or national public bodies from European member states or from European institutions (e.g. EurostatEEA, …).

Some starting points for you to get data are http://publicdata.eu or http://lod2.okfn.org. The organisers are focused on solutions that are reusable in different countries, cover pan-European issues and use open licenses for any code, content and data. Get all the info about the competition and on how to join here.

We are very eager to see what you come up with so share your work with us in the Data Art Corner or in the comments!


Data Journalism: The Story So Far

DATA MINER UK – by Nicola Hughes

Such a great article on the story of data journalism by Nicola Hughes that we decided to put it all! Get the original article on Data Miner UK

[youtube 3YcZ3Zqk0a8]

And here’s what Tim Berner-Lee, founder of the internet, said regarding the subject of data journalism:

Journalists need to be data-savvy… [it’s] going to be about poring over data and equipping yourself with the tools to analyse it and picking out what’s interesting. And keeping it in perspective, helping people out by really seeing where it all fits together, and what’s going on in the country

How the Media Handle Data:

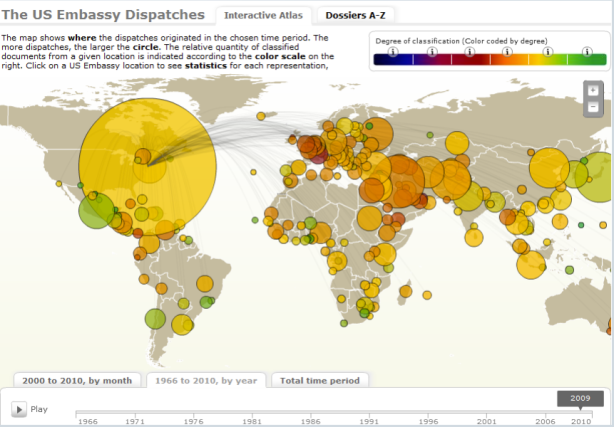
Data has sprung onto the journalistic platform of late in the form of the Iraq War Logs (mapped by The Guardian), the MP’s expenses (bought by The Telegraph) and the leaked US Embassy Cables (visualized by Der Spiegel). What strikes me about these big hitters is the existence of the data is a story in itself. Which is why they had to be covered. And how they can be sold to an editor. These data events force the journalistic platform into handling large amounts of data. The leaks are stories so there’s your headline before you start actually looking for stories. In fact, the Fleet Street Blues blog pointed out the sorry lack of stories from such a rich source of data, noting the quick turn to headlines about Wikileaks and Assange.

Der Spiegel - The US Embassy Dispatches
Der Spiegel – The US Embassy Dispatches


So journalism so far has had to handle large data dumps which has spurred on the area of data journalism. But they also serve to highlight the fact that the journalistic platform as yet cannot handle data. Not the steady stream of public data eking out of government offices and public bodies. What has caught the attention of news organizations is social media. And that’s a steady stream of useful information. But again, all that’s permitted is some fancy graphics hammered out by programmers who are glad to be dealing with something more challenging than picture galleries (here’s an example of how  CNN used twitter data).

So infographics (see the Stanford project: Journalism in the Age of Data) and interactives (e.g. New York Times: A Peek into Netflix Queues) have been the keystone from which the journalism data platform is being built. But there are stories and not just pictures to be found in data. There are strange goings-on that need to be unearthed. And there are players outside of the newsroom doing just that.

How the Data Journalists Handle Data:

Data, before it was made sociable or leakable, was the beat of the computer-assisted-reporters (CAR). They date as far back as 1989 with the setting up of the National Institute for Computer-Assisted Reporting in the States. Which is soon to be followed by the European Centre for Computer Assisted Reporting. The french group, OWNI, are the latest (and coolest) revolutionaries when it comes to new age journalism and are exploring the data avenues with aplomb. CAR then morphed into Hacks/Hackers when reporters realized that computers were tools that every journalist should use for reporting. There’s no such thing as telephone-assisted-reporting.  So some whacky journalists (myself now included) decided to pair up with developers to see what can be done with web data.

This now seems to be catching on in the newsroom. The Chicago Tribune has a data center, to name just one. In fact, the data center at the Texas Tribune drives the majority of the sites traffic. Data journalism is growing alongside the growing availability of data and the tools that can be used to extract, refine and probe it. However, at the core of any data driven story is the journalist. And what needs to be fostered now, I would argue, is the data nose of a (any) journalist. Journalism, in its purest form, is interrogation. The world of data is an untapped goldmine and what’s lacking now is the data acumen to get digging. There are Pulitzers embedded in the data strata which can be struck with little use of heavy machinery. Data driven journalism and indeed CAR has been around long before social media, web 2.0 and even the internet. One of the earliest examples of computer assisted reporting was in 1967, after riots in Detroit, when Philip Meyer used survey research, analyzed on a mainframe computer, to show that people who had attended college were equally likely to have rioted as were high school dropouts. This turned the publics’ attention to the pervasive racial discrimination in policing and housing in Detroit.

Where Data Fits into Journalism:

I’ve been looking at the States and the broadsheets reputation for investigative journalism has produced some real gems. What stuck me, by looking at news data over the Atlantic, is that data journalism has been seeded earlier and possibly more prolifically than in the UK. I’m not sure if it’s more established but I suspect so (but not by a wide margin). For example, at the end of 2004, the then Dallas Morning News analyzed the school test scores of the Texas Assessment of Knowledge and Skills and uncovered one school’s alleged cheating on standardized tests. This then turned into a story on cheating across the state. The Seattle Times piece of 2008, logging and landslides, revealed how a logging company was blatantly allowed to clear-cut unstable slopes. Not only did they produce and interactive but the beauty of data journalism (which is becoming a trend) is to write about how the investigation was uncovered using the requested data.

The Seattle Times: Landslides in the Upper Chehalis River Basin


Newspapers in the US are clearly beginning to realize that data is a commodity for which you can buy trust from your consumer. The need for speed seems to be diminishing as social media gets there first, and viewers turn to the web for richer information. News in the sense of something new to you, is being condensed into 140 character alerts, newsletters, status updates and things that go bing on your mobile device. News companies are starting to think about news online as exploratory information that speaks to the individual (which is web 2.0). So the The New York Times has mapped the census data in its project “Mapping America: Every City, Every Block”. The Los Angeles Times has also added crime data so that its readers are informed citizens not just site surfers. My personal heros are the investigative reporters at ProPublica who not only partner with mainstream news outlets for projects like Dollars for Doctors, they also blog about the new tools they’re using to dig the data. Proof the US is heading down the data mine is the fact that Pulitzer finalists for local journalism included a two year data dig by the Las Vegas Sun into preventable medical mistakes in Las Vegas hospitals.

Lessons in Data Journalism:

Another sign that data journalism is on the up is the recent uptake at teaching centres for the next generation journalist. Here in the UK, City University has introduced an MA in Interactive Journalism which includes a module in data journalism. Across the pond, the US is again ahead of the game with Columbia University offering a duel masters’ in Computer Science and Journalism. Words from the journalism underground are now muttering terms like Goolge Refine, Ruby and Scraperwiki. O’Reilly Radar has talked about data journalism.

The beauty of the social and semantic web is that I can learn from the journalists working with data, the miners carving out the pathways I intend to follow. They share what they do. Big shot correspondents get a blog on the news site. Data journalists don’t, but they blog because they know that collaboration and information is the key to selling what it is they do (e.g Anthony DeBarros, database editor at USA Today). They are still trying to sell damned good journalism to the media sector!  Multimedia journalists for local news are getting it (e.g David Higgerson, Trinity Mirror Regionals). Even grassroots community bloggers are at it (e.g. Joseph Stashko of Blog Preston). Looks like data journalism is working its way from the bottom up.

Back in Business:

Here are two interesting articles relating to the growing area of data and data journalism as a business. Please have a look: Data is the New Oil and News organizations must become hubs of trusted data in a market seeking (and valuing) trust.


Open Data And Emergent Digital Horizons At Future Everything 2011 [Event]

PSFK: by Stephen Fortune

Picture from the PSFK website

Now in it’s 16th year, the recently-renamed FutureEverything Festival will continue to showcase and illuminate creative technologies and digital innovation this coming May in Manchester, UK.

Befitting it’s role in leading Manchester’s recent Open Data revolution, FutureEverything will provide centre stage consideration of Open Data as part of it’s two day conference. Open Data is shifting the digital landscape in a manner comparable to the sea changes which followed in the wake of social media and FutureEverything 2011 offers the means to understand how it will transform the way consumers engage with brands, and the ways citizens engage in local government. The topics under consideration range from the enterprise that can be fomented with open data to what shape algorithm driven journalism will take. [Read more…]


#opendata: What is open government data? What is it good for? [VIDEO]

#opendata film

[vimeo 21711338]

This short film by the Open Knowledge Foundation deals with the raise of open government data and can be found on the Open Government Data website. Open data is changing the relationship between citizens and their government. People are now more aware of government’s spending, who is representing them, and the companies that do business with the government. Some say that open data is bringing a global social change, that it is modifying the way society works.Watch this film and tell us what you think…


Announcing news:rewired – noise to signal, 27 May 2011

NEWS REWIRED

Logo from the News:Rewired website

Journalism.co.uk’s next News:Rewired event will take place on 27 May at Thomson Reuters’ London offices.

What’s it about?

news:rewired – noise to signal is a one-day event for journalists and communications professionals who want to learn more about the latest tools and strategies to filter large datasets, social networks, and audience metrics into a clear signal for both the editorial and business side of the news industry. [Read more…]


#ijf11: the raise of Open Data

source: Joel Gunter from Journalism.co.uk

Picture: "Where does my money go?" by the Open Knowledge Foundation

The open data movement, with the US and UK governments to the fore, is putting a vast and unprecedented quantity of republishable public data on the web. This information tsunami requires organisation, interpretation and elaboration by the media if anything eye-catching is to be made of it.

Experts gathered at the International Journalism Festival in Perugia last week to discuss what journalistic skills are required for data journalism.

Jonathan Gray, community coordinator for the Open Knowledge Foundation, spoke on an open data panel about the usability of data. “The key term in open data is ‘re-use’,” he told Joel Gunter from Journalism.co.uk.

Government data has been available online for years but locked up under an all rights reserved licence or a confusing mixture of different terms and conditions.

The Open Knowledge Foundation finds beneficial ways to apply that data in projects such as Where Does My Money Go which analyses data about UK public spending. “It is about giving people literacy with public information,” Gray said.

The key is allowing a lot more people to understand complex information quickly.

Along with its visualisation and analysis projects, the Open Knowledge Foundation has established opendefinition.org, which provides criteria for openness in relation to data, content and software services, and opendatasearch.org, which is aggregating open data sets from around the world.

“Tools so good that they are invisible. This is what the open data movement needs”, Gray said.

Some of the Google tools that millions use everyday are simple, effective open tools that we turn to without thinking, that are “so good we don’t even know that they are there”, he added.

Countries such as Itlay and France are very enthusiastic about the future of open data. Georgia has launched its own open data portal, opendata.ge.

The US with data.gov, spend £34 million a year maintaining that various open data sites. Others are cheap by comparison, with the UK’s data.gov.uk reportedly costing £250,000 to set up.