The Data Journalism Handbook: Teaching the World how to work with data [VIDEO]

This video is cross posted on DataDrivenJournalism.net, the Open Knowledge Foundation blog and on the Data Journalism Blog.

The Data Journalism Handbook is a project coordinated by the European Journalism Centre and the Open Knowledge Foundation, launched at the Mozilla Festival in London on 5 November 2011.

Journalists and experts in data gathered to create the first ever handbook to data journalism over a two-days challenge.

Read more about the Data Journalism Handbook in this article by Federica Cocco.

What data tool or great example of data journalism would you add to the handbook? Let’s make this comments section useful!

Every contribution, big or small, to the Data Journalism Handbook is very much appreciated. So use this space to give us links and examples to what you think should be included in the manual.

And if you feel more chatty, email us at editor@datajournalismblog.com

Hacks and hackers gather to write the first Data Journalism Handbook

By Federica Cocco

This article is cross posted on DataDrivenJournalism.net, the Open Knowledge Foundation blog and on the Data Journalism Blog.

Ravensbourne college is an ultramodern cubist design school which abuts the O2 arena on the Greenwich peninsula. It is perhaps an unusual and yet apt setting for journalists to meet.

Members of the Open Knowledge Foundation and the European Journalism Centre saw this as a perfect opportunity to herd a number of prominent journalists and developers who, fuelled by an unlimited supply of mocacchinos, started work on the first Data Journalism Handbook.

The occasion was the yearly Mozilla Festival, which acts as an incubator to many such gatherings. This year the focus was on media, freedom and the web.

The manual aims to address one crucial problem: “There are a lot of useful resources on the web,” Liliana Bounegru of the EJC said, “but they are all scattered in different places. So what we’re trying to do is put everything together and have a comprehensive step-by-step guide”.

In data journalism, most people are self-taught, and many find it hard to keep up-to-date with every tool produced by the industry. “It could be vital having a handbook that really explains to journalists how you can approach data journalism from scratch with no prior knowledge, ” says Caelainn Barr of the Bureau of Investigative Journalism
Friedrich Lindenberg of the OKF believes there is a real urgency in making newsrooms data-literate: “If journalists want to keep up with the information they need to learn coding, and some bits of data analysis and data-slicing techniques. That will make much better journalism and increase accountability.”

And who better than the New York Times’ Interactive Editor Aron Pilhofer, The Guardian Data Blog’s Simon Rogers and others to lead the ambitious efforts?
In charge of sorting the wheat from the chaff, around 40 people joined them in the sixth floor of the college, for a 48 hour session.

The first draft of the handbook should be ready in the coming months, as other contributions from every corner of the web are still working on making an input.
Of course the first data journalism handbook had to be open source. How else would it be able to age gracefully and be relevant in years to come?

Workshops of this sort represent a decisively different break from the past. Aspiring data journalists will know that hands-on sessions are a cut above the usual lectures featuring knowledgeable speakers and PowerPoint presentations. Discussing the topic and citing examples is not enough. After all, if you give a man a fish you have fed him for a day. But if you teach a man ho w to fish, you have him fed for a lifetime.

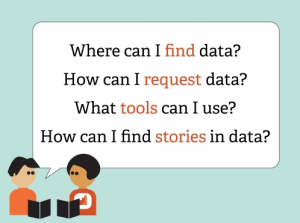
Jonathan Gray concurs: “Rather than just provide examples of things that have been done with data, we want to make it easier for journalists to understand what data is available, what tools they can use to work with data, how they can visualise data sets and how they can integrate that with the existing workflows of their news organisations.”

At the event itself, after a brief introduction, the crowd split into five groups and began collaborating on each chapter of the handbook. Some were there to instill knowledge, others were there to absorb and ask questions.

“I like the fact that everyone is bringing a different skillset to the table, and we’re all challenging each other”, one participant said.

Francis Irving, CEO of ScraperWiki, led the session on new methods of data acquisitions. He believes the collaboration between journalists, programmers, developers and designers, though crucial, can generate a culture clash: “When working with data, there’s a communication question, how do you convey what you need to someone more technical and how do they then use that to find it in a way that’s useful.”

“A project like this is quite necessary,” noted Pilhofer, “It’s kind of surprising someone hasn’t tried to do this until now.”

The free e-book will be downloadable from the European Journalism Centre’s DataDrivenJournalism.net/handbook in the coming months. If you want to follow our progress or contribute to the handbook you can get in touch via the data journalism mailing list, the Twitter hashtags #ddj and #ddjbook, or email bounegru@ejc.net.

Watch here the full video report from the Data Journalism Handbook session at the Mozilla Festival, 4-6 November in London.

The organisers would like to thank everyone who is contributing to the handbook for their input and to Kate Hudson for the beautiful graphics.

 
About the author: Federica Cocco is a freelance journalist and the former editor of Owni.eu, a data-driven investigative journalism site based in Paris. She has also worked with Wired, Channel 4 and the Guardian. 


6 Data Journalism Blogs To Bookmark, Part 2

10,000 WORDS – By Elana Zak

Editor’s Note: This is the second part of a post from 10,000 Words. Find the first one here which included the Guardian’s Data Blog, Pro Publica and your very own Data Journalism Blog…

Last week, I started a list of six data journalism blogs you should take note of. The post stemmed from a project some journalists are leading to develop a data-driven journalism handbook that covers all aspects of the field. This weekend, thanks to a massive effort by attendees at the Mozilla Festival in London, the project morphed from the bare bones of an idea into something very tangible.

In just two days, 55 contributors, from organizations such as the New York Times, the Guardian and Medill School of Journalism, were able to draft 60 pages, 20,000 words, and six chapters of the handbook. The goal is to have a comprehensive draft completed by the end of the year, said Liliana Bounegru of the European Journalism Centre, which is co-sponsoring production of the handbook. If you’re interested in contributing, email Bounegru at bounegru@ejc.net. You can see what the group has so far atbit.ly/ddjbook.

Since the handbook is still being tweaked, why not check out these data journalism blogs?

Open
Like the Guardian, the New York Times is widely known for its spectacular use of data journalism and news apps. Open is written by the news organization’s developers, highlighting hacking events and describing general news of interest to the bloggers.

Data Desk
The Los Angeles Times is at the forefront of data journalism, with its Data Desk blog covering topics from crime to the Lakers to vehicle complaints. Everything on the site is a great example of how to use data to find and craft stories that will matter to your readers. One project I highly recommend you take a look at is mapping LA’s neighborhoods. It is something that could be replicated in almost any town and would grab your audience’s’ attention.

News Apps Blog
The News Apps blog is where developers from the Chicago Tribune discuss “matters of interest” and give their tips and suggestions on how to make some of the stunning maps and apps that appear in the paper. This is one of, if not the, place to go to see what experts in the field are talking about.

What data journalism blogs do you go to?

Image from the Data Journalism Handbook presentation.

The Data Journalism Handbook at #MozFest 2011 in London

The following post is from Jonathan Gray, Community Coordinator at the Open Knowledge Foundation.

With the Mozilla Festival approaching fast, we’re getting really excited about getting stuck into drafting the Data Journalism Handbook, in a series of sessions run by the Open Knowledge Foundation and the European Journalism Centre.

As we blogged about last month, a group of leading data journalists, developers and others are meeting to kickstart work on the handbook, which will aim to get aspiring data journalists started with everything from finding and requesting data they need, using off the shelf tools for data analysis and visualisation, how to hunt for stories in big databases, how to use data to augment stories, and plenty more.

We’ve got a stellar line up of contributors confirmed, including:

Here’s a sneak preview of our draft table of contents:

  • Introduction
    • What is data journalism?
    • Why is it important?
    • How is it done?
    • Examples, case studies and interviews
      • Data powered stories
      • Data served with stories
      • Data driven applications
    • Making the case for data journalism
      • Measuring impact
      • Sustainability and business models
    • The purpose of this book
    • Add to this book
    • Share this book
  • Getting data
    • Where does data live?
      • Open data portals
      • Social data services
      • Research data
    • Asking for data
      • Freedom of Information laws
      • Helpful public servants
      • Open data initiatives
    • Getting your own data
      • Scraping data
      • Crowdsourcing data
      • Forms, spreadsheets and maps
  • Understanding data
    • Data literacy
    • Working with data
    • Tools for analysing data
    • Putting data into context
    • Annotating data
  • Delivering data
    • Knowing the law
    • Publishing data
    • Visualising data
    • Data driven applications
    • From datasets to stories
  • Appendix
    • Further resources

If you’re interested in contributing you can either:

  1. Come and find us at the Mozilla Festival in London this weekend!
  2. Contribute material virtually! You can pitch in your ideas via the public data-driven-journalismmailing list, via the #ddj hashtag on Twitter, or by sending an email to bounegru@ejc.net.

We hope to see you there!

Data-Driven Journalism In A Box: what do you think needs to be in it?

The following post is from Liliana Bounegru (European Journalism Centre), Jonathan Gray (Open Knowledge Foundation), and Michelle Thorne (Mozilla), who are planning a Data-Driven Journalism in a Box session at the Mozilla Festival 2011, which we recently blogged about here. This is cross posted at DataDrivenJournalism.net and on the Mozilla Festival Blog.

We’re currently organising a session on Data-Driven Journalism in a Box at the Mozilla Festival 2011, and we want your input!

In particular:

  • What skills and tools are needed for data-driven journalism?
  • What is missing from existing tools and documentation?

If you’re interested in the idea, please come and say hello on our data-driven-journalism mailing list!

Following is a brief outline of our plans so far…

What is it?

The last decade has seen an explosion of publicly available data sources – from government databases, to data from NGOs and companies, to large collections of newsworthy documents. There is an increasing pressure for journalists to be equipped with tools and skills to be able to bring value from these data sources to the newsroom and to their readers.

But where can you start? How do you know what tools are available, and what those tools are capable of? How can you harness external expertise to help to make sense of complex or esoteric data sources? How can you take data-driven journalism into your own hands and explore this promising, yet often daunting, new field?

A group of journalists, developers, and data geeks want to compile a Data-Driven Journalism In A Box, a user-friendly kit that includes the most essential tools and tips for data. What is needed to find, clean, sort, create, and visualize data — and ultimately produce a story out of data?

There are many tools and resources already out there, but we want to bring them together into one easy-to-use, neatly packaged kit, specifically catered to the needs of journalists and news organisations. We also want to draw attention to missing pieces and encourage sprints to fill in the gaps as well as tighten documentation.

What’s needed in the Box?

  • Introduction
    • What is data?
    • What is data-driven journalism?
    • Different approaches: Journalist coders vs. Teams of hacks & hackers vs. Geeks for hire
    • Investigative journalism vs. online eye candy
  • Understanding/interpreting data:
    • Analysis: resources on statistics, university course material, etc. (OER)
    • Visualization tools & guidelines – Tufte 101, bubbles or graphs?
    • Acquiring data
  • Guide to data sources
  • Methods for collecting your own data
  • FOI / open data
  • Scraping
    • Working with data
  • Guide to tools for non-technical people
  • Cleaning
    • Publishing data
  • Rights clearance
  • How to publish data openly.
  • Feedback loop on correcting, annotating, adding to data
  • How to integrate data story with existing content management systems

What bits are already out there?

What bits are missing?

  • Tools that are shaped to newsroom use
  • Guide to browser plugins
  • Guide to web-based tools

Opportunities with Data-Driven Journalism:

  • Reduce costs and time by building on existing data sources, tools, and expertise.
  • Harness external expertise more effectively
  • Towards more trust and accountability of journalistic outputs by publishing supporting data with stories. Towards a “scientific journalism” approach that appreciates transparent, empirically- backed sources.
  • News outlets can find their own story leads rather than relying on press releases
  • Increased autonomy when journalists can produce their own datasets
  • Local media can better shape and inform media campaigns. Information can be tailored to local audiences (hyperlocal journalism)
  • Increase traffic by making sense of complex stories with visuals.
  • Interactive data visualizations allow users to see the big picture & zoom in to find information relevant to them
  • Improved literacy. Better understanding of statistics, datasets, how data is obtained & presented.
  • Towards employable skills.