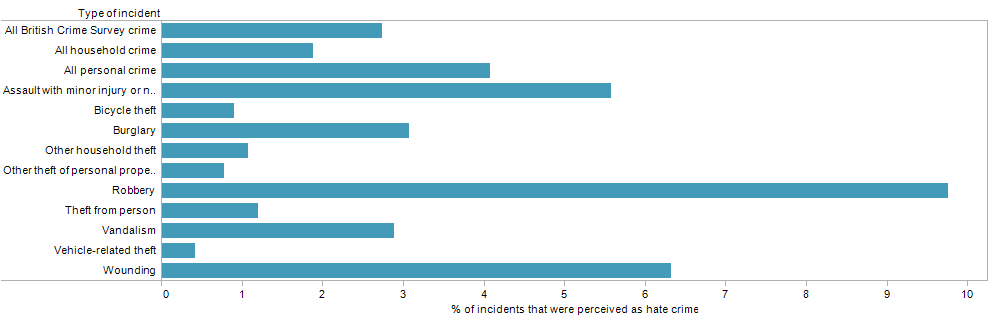
What percentage of crimes are motivated by hate?
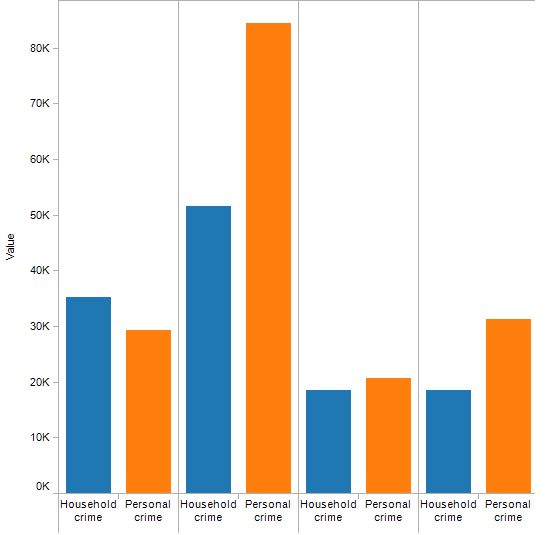
Number of incidents of hate crime by strand

Get the latest news on data driven journalism with interviews, reviews and news features
What percentage of crimes are motivated by hate?
Number of incidents of hate crime by strand
After spending the past seven months studying data, I’ve learnt at least one important lesson: data journalism doesn’t have to be impossibly hard. While there are plenty of things about data journalism which will always go straight over my head – there are also a lot of easy techniques, formulas and programmes. So here are my top 5 data recommendations, for dummies.
As an aspiring data journalist, I was excited (and relieved) to flick through the new Data Journalism Handbook. The internet is awash with tutorials on visualising techniques and coding, but there’s a lack of documentation providing an overview of the field.
At City University, we have spent the past three weeks running a local news service for Islington. Along with door knocking and vox popping, data was an endless source of stories – from car parking charges to pregnancy rates.
But while the data is easy to find – a local authority breakdown of statistics is normally available in supplementary tables – the story isn’t always obvious.
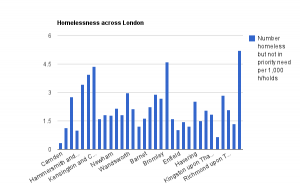
Having heard councillors warn that Islington’s homeless population has grown rapidly out of control, we looked at the newly released national homelessness statistics to see how it compared with other London boroughs.
But on first glance, Islington appeared to have low levels of homelessness. In terms of the numbers accepted as being homeless and in priority need it rated 19th worst out of 33 boroughs.
When we looked at the total number of “non-priority” homeless people the figures were more shocking – Islington had the 6th highest in London. And, after we factored in the size of Islington – which is far smaller than other boroughs – we found Islington had the fourth highest rate, per 1,000 households.
The exercise proved data journalism isn’t just for the nationals – and that by examining statistics from a local perspective, journalists can make more sense of the numbers.